


Microsoft Data Solutions and Services
Azure & Data Warehousing
Power BI Solutions
Azure Resource Monitoring
Power BI Trainings
Power BI Map Visualizations
Data Warehouse Automation
DWH Automation - Quickly and Simply!
Main Features of Rapid Analytics

RAPID DATA WAREHOUSING
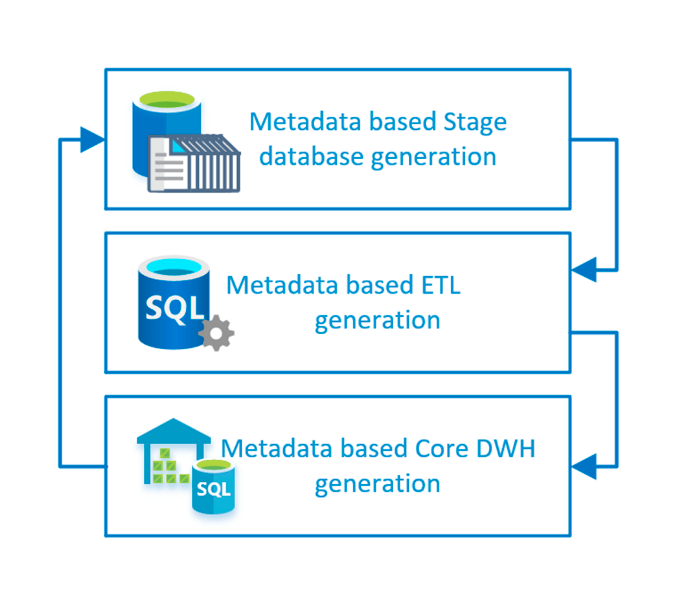
With our metadata engine and industry proven templates, you can automate your database layers (stage, data warehouse, data mart) and the relating ETL (extract, transform, load) layers with ease.

LOW-COST DWH IMPLEMENTATION
Developers can concentrate on real business value and let the engine do the time-consuming data preparation which can lead to 85% cost reduction using the most popular data warehousing platforms.

DEVOPS AND AGILITY
With our built-in Azure DevOps, PowerShell and Git based toolset agile deployment and continuous integration can be achieved, allowing multiple daily automated deployments even in very complex DWH / BI / AI solutions.

ETL AUTOMATION
Industry best practice based templates generate full and delta loads for typical enterprise data sources. Just tell us what to load and we will handle the rest.

STAGE AND ODS AUTOMATION
Automatically generate and feed STAGE and ODS layers of a data warehouse based on our metadata layers and templates.

HISTORY LAYER AUTOMATION
Our industry proven templates support the widely used slowly changing dimension types with high performance.

CUSTOMIZABLE TEMPLATES
Highly customizable templates for enterprise customers to handle local needs.

INTELLIGENT SCHEMA CHANGE DETECTION
Has the source system’s schema changed? No worries, Abylon Rapid Analytics tracks it and helps you to react in minutes

OPTIMIZATION PACKS
Supporting the most advanced SQL Server optimization tips to achieve the best performance automatically.
Data Warehousing with Abylon Rapid Analytics
Abylon Rapid Analytics is a data warehouse automation tool-set to implement and automate data warehouse, data lake and analytical solutions. Using its’ metadata layer and industry proven templates, the development of logical data warehouse or data lake layers and ETL processes becomes quick, easy, cost effective. Based on our previous experiences using Abylon Rapid Analytics can reduce implementation time and costs by up to 85% compared to standard DWH projects. This is an average 150.000 EUR saving on such projects.
| Typical tasks | Traditional methodology | Using Abylon Rapid Analytics | Cost reduction |
| ETL Planning | 20 days | 5 days | -75% |
| ETL Development | 100 days | 5 days | -95% |
| Stage Development and Optimization | 10 days | 2 days | -80% |
| DWH Development and Optimization | 50 days | 10 days | -80% |
| Testing and Debugging | 50 days | 10 days | -80% |
| DevOps | 30 days | 3 days | -90% |
| Monitoring | 20 days | 2 days | -90% |
| Total | 280 days | 37 days | -85% |
Business Intelligence Solutions
Our Business Intelligence Solutions
Data Warehousing & Automation
Our Data Warehouse automation toolkit helps our clients to onboard on a fully production ready data warehouse in just a matter of days. No need to develop complex ETL processes manually or hassle with difficult delta loads, slowly changing dimensions, Abylon Rapid Platform does it for you!
Rapid Planning and Analysis (FP&A)
Advanced Map Visualization
Our Main BI Services

DATA WAREHOUSE IMPLEMENTATION
The heart of an enterprise data solution is an agile data warehouse and data lake solution. We are using the most cutting edge technologies to design and build the most flexible and efficient data platforms for our customers. Who has the best assets in data will have a good chance to be the winner of our time

BUSINESS INTELLIGENCE
Our business intelligence team helps you understand your data with well-crafted dashboards and reports, helping your business users to facilitate a truly data driven culture from enterprise level solution to a truly self-service BI solution. Let us guide you in the most exciting journey of the 21st century.

ADVANCED ANALYTICS
Statistics and mathematics are in place for helping us to make decisions based on historical data. Our mission is to truly enable our customers to be data driven by helping them on machine learning and AI projects, by defining together the strategy for advanced analytics and achieve the best results in our fast-changing market. Who can make the most from data can be the winner of the 21st century.

GOVERNANCE AND CLOUD-MIGRATIONS
The technology landscape is in a significant shift from traditional software solutions to cloud based platforms where some of the most innovative solutions became available to our customers in a rapid way. We believe, our experience from traditional IT and data analytics project to the most cutting edge cloud technologies makes us the best partner for our customers to onboard of the super-exciting cloud data analytics journey of our time.

INTEGRATED DIGITAL ANALYTICS
Selling for customers on the best way is a big differentiator between successful and lagging companies. Our unique approach based on our expertise can help you efficiently integrate your digital channels with your traditional data warehouses and line-of business systems to give you single pane of view where to invest in marketing, how to address your customers with marketing messages. We can build you the best integrated digital sales analytics solution in weeks to support your journey in model digital selling.

PLANNING AND WHAT-IF ANALYTICS
Business Intelligence can not give you a solid view on your business without high quality planning data based on different scenarios and assumptions. Our cutting-edge write-back technology enables our customers to use their Power BI as a single platform for managing your business and also to make business planning and forecasting, what-if analytics directly through the user interface of Microsoft reporting technologies.
Technologies We Work With
Azure Resource Health and Utilization Monitoring
Monitoring Difficulties in Azure
”Has today’s data load & report refresh finished already? I need to know when, and how long it takes on average, so that I can set my meetings accordingly.” – asked the Team Lead the Developer.
“Let me check, but my query also runs so damn slow, maybe something is going on, I don’t know… I can’t really reach it either.”
“Isn’t it available? I need to use it ASAP. Anyway, if it’s so slow, why don’t we scale it up? We should know the exact utilization, because I want to avoid 2 things: being slow by constantly hitting the ceiling with current setup & throwing money out of the window by not using it at all.” – the Team Lead replied.
Since you are on this page this conversation is somewhat similar to you. There are partial solutions for this problem, where you can check status separately, but wouldn’t it be cool to see everything in on place in an Azure Dashboard? This is exactly what we offer.
Monitor Health Metrics
Our solution allows you to:
- Perform health check of any specific ADLS, VM, SQL DB, Key Vault, etc.
- Check if resources in West Europe up or down
- Check resource availability within a specific VNET / Subnet
Track Execution Logs
You can track:
- Pipeline execution results: succeeded / failed
- Loads that are still in progress
- Average execution time of a complete solution, what time does it usually finish until (and on today)
List Actual Usage or Utilization Metrics
You can track:
- Synapse – Apache spark pool
- Synapse – Dedicated pool
- Databricks – Cluster
- Azure Machine Learning – Endpoint
Listing Custom Metrics
Custom Metrics Examples:
- DB distinct user list per day
- Detailed logs of ML model train per cluster
- Cluster usage per hour on a weekday
- Utilization chart
- Memory allocation per solution
Why Choose Abylon?
With a strong foundation in business intelligence, Abylon has successfully delivered over 100 projects, specializing in data analytics, data warehouse, and data lakehouse building.
Abylon has been a Microsoft partner since its foundation. We’ve been delivering large scale enterprise BI projects using Microsoft Azure for some of the largest companies in the CE region, as well as for large, international firms. We use Azure daily, design architectures, make developments, and operate them afterwards. Our expertise in Azure enables us to create a dashboard that you will definitely pin to your taskbar.
BI Trainings and Workshops
Empower your team with Business Intelligence and Advanced Data analytics training and transform your business into a Data-Driven Powerhouse.
Our BI Training Services
We help customers onboard their teams to the most advanced data analytics platforms, making them truly data-driven companies. Abylon Consulting has a long history of delivering BI and Data Analytics trainings, both directly and through our partnership with Microsoft.
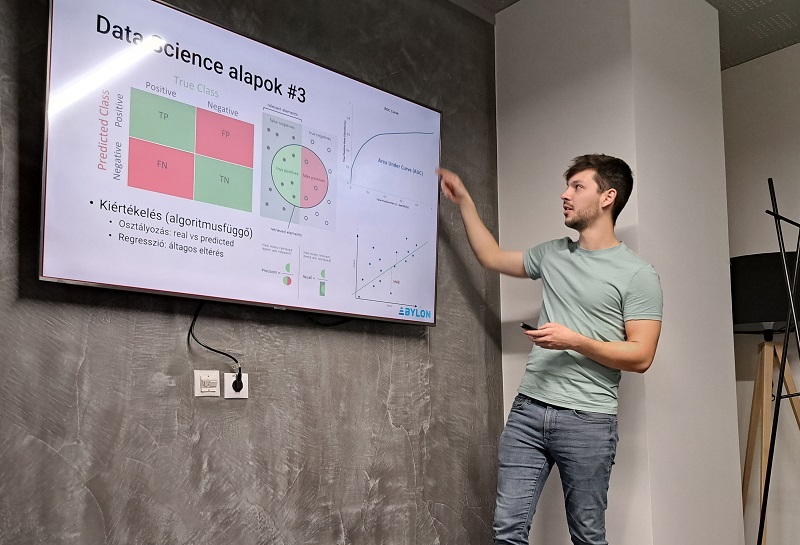
As a Microsoft partner since our inception, we leverage deep expertise in Microsoft’s data analytics and BI products. Many of our colleagues are former Microsoft experts, ensuring our training programs are comprehensive and aligned with the latest industry standards and best practices.
Popular Business Intelligence Trainings
- Power BI for beginners – Microsoft proctored Dashboard in a Day training session
- Power BI for advanced users – custom training
- Power BI "On the Job" training – learn and create an actual report with your own data
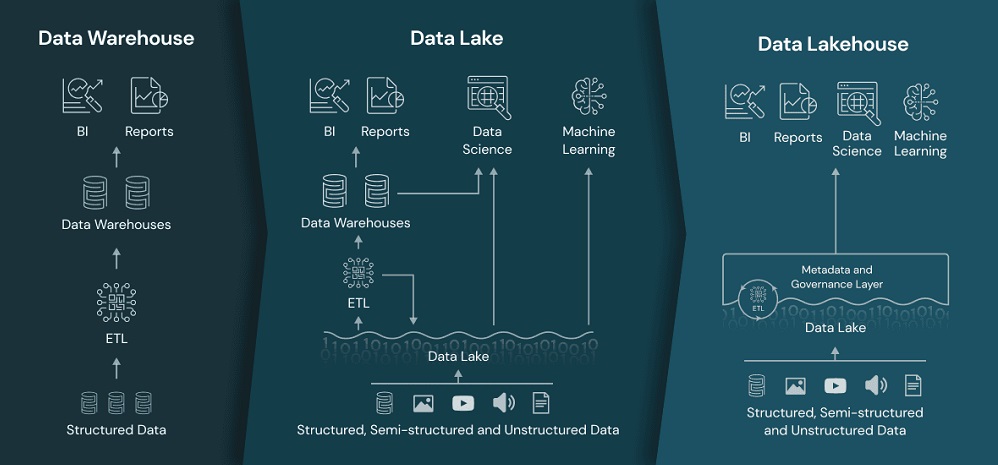
- Databricks & Data Lakehouse concepts – The next-gen architecture
- Microsoft Fabric tutorial – intro course for beginners
- Advanced Analytics – How to begin from scratch
- Introduction to data systems – Basic guide for newcomers
- Microsoft Data warehousing – Azure or SQL Server OnPrem
- Advanced Microsoft Business Intelligence with SQL Server – OLAP cube and reporting
- Python / ML / Data Science basics
Power BI DIAD Training
Databricks & Data Lakehouse Concepts Training
Our “Databricks & Data Lakehouse Concepts” training delves into the core functionalities of the Databricks platform, including its powerful data lakehouse architecture. Participants will learn how to leverage Databricks for data analytics, big data processing, and AI workflows, turning complex data into clear insights and actionable strategies.
This training is designed for professionals seeking to master the Databricks platform and its data lakehouse capabilities. Attendees will gain hands-on experience and insights from our certified experts, making Abylon the perfect partner to guide your learning journey.
Why Choose Abylon?
Abylon Consulting is a highly experienced business intelligence company with over 100 successful BI and Data Analytics projects. We are official, certified partners of both Microsoft and Databricks, ensuring that our solutions and trainings are built on industry-leading technologies.
With extensive hands-on experience across a range of BI and data analytics tools and platforms, including Microsoft’s data analytics stack and the Databricks platform, we have a deep understanding of the essential tools and technologies that unlock valuable insights and drive growth. Our expertise is forged by years of practical application, not just theoretical knowledge.
Our team comprises numerous certified experts who bring deep expertise and hands-on experience in data analytics, data warehousing, and data lakehouse implementations. Beyond our technical prowess, we excel in conducting both in-person and online trainings and workshops, making complex concepts accessible and actionable for your team.
Choose Abylon for extensive knowledge and a commitment to transforming your data into clear insights and actionable strategies.
Custom Power BI Map Visualizations
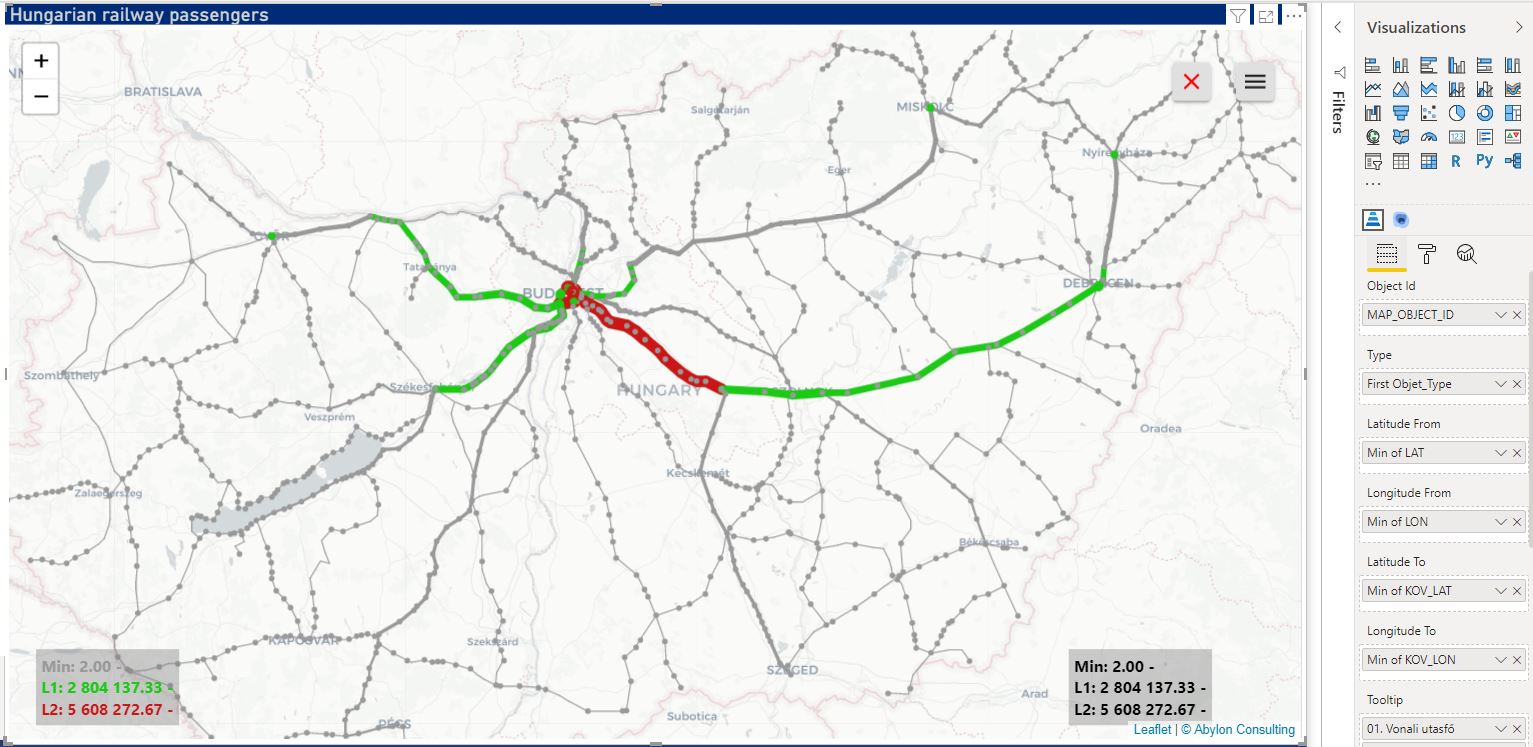
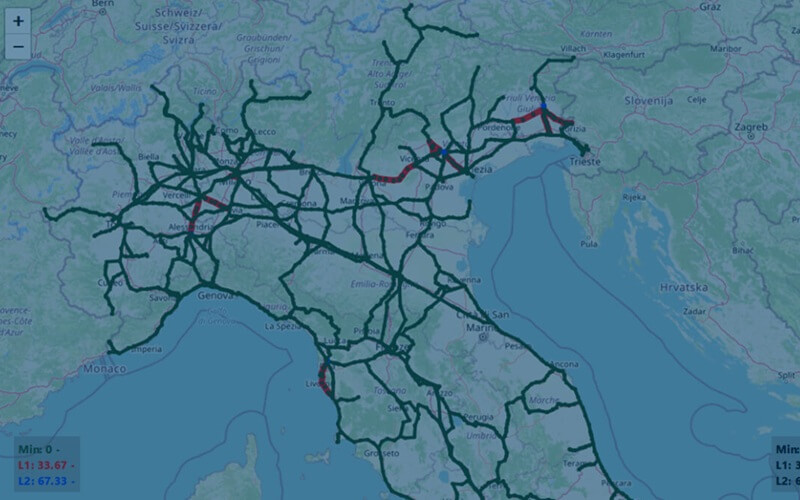
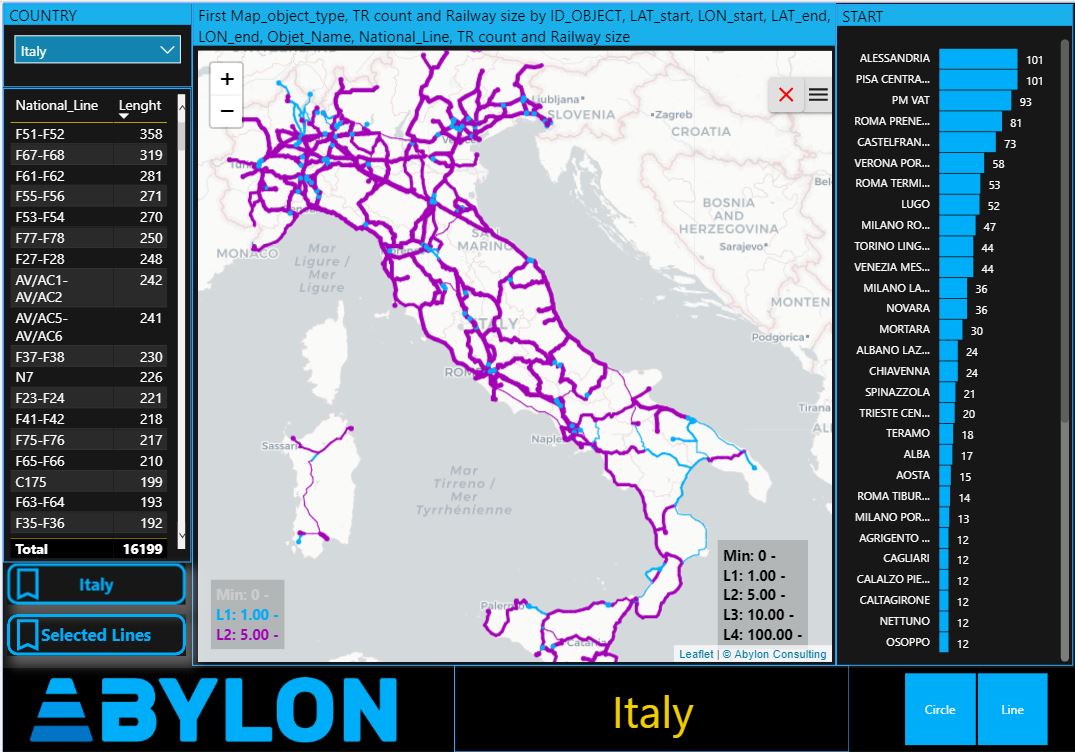
We provide advanced map visualization on top of Power BI for some of the most complex infrastructure providers. Our Power BI custom map solution gives analysts an easy tool-set with domain specific visualizations to make your data speak in the context of our customer’s line-based physical infrastructure.
Benefits of Abylon MAP Visualizations
INFRASTRUCTURE-SPECIFIC VISUALIZATIONS AND DATA MODELS
ACTIVE MAPS BASED ON POWER BI MODELS OR GEOJSON URL
DISCOVER HIDDEN PATTERNS AND WHAT IF ANALYTICS
GIVE DATA MEANINGFULL CONTEXT FOR EFFECTIVE ANALYTICS
Advanced Power BI Maps
- Visualization of linebased networks using coordinates in the data model or external GeoJson layer descriptions
- Visualization of locations (e.g.: railways stations) on top of the line-based infrastructure
- Selection engine for interactivity and cross filtering inside a Power BI report
- Flexible rules for colors / widths – from easy-to-use automatic rules to fully customizable DAX based calculations
Main Features of Abylon MAP

USE CIRCLES AND LINES FOR OBJECT TYPES
Use multiple object types (circles and lines) at the same time. Select circles or lines with interval (from-to) , drill down from areas, divide lines by direction, use geojson files for lines, points, areas and much-much more.

MULTIPLE POINT & ROUTE SELECTION, MULTIPLE LAYERS
Select multiple routes at the same time or search for and zoom geographical locations all inside Abylon MAP. Use multiple layers simultaneously, ror example: Layer 1-2 – regions with two aggregated KPI’s, Layer 3 – line or circle based map.

EASY-TO-USE PARAMETERS FOR DIFFERENT COLORS, WIDTHS
Coloring, line-weighting and circle sizing by measures, all at same time. Multiple types of calculation methods of weight and colors: linear calculation, manual or color scale.

NO DEVELOPER SKILLSET REQUIRED
Using Abylon MAP requires no developer skills. This easy-to-use approach, combined with the rapid implementation, allows for a super quick go-live.

COMPLETE CROSS FILTERING INSIDE POWER BI
Power BI filters the visualization inside Abylon Map layers. Search for and zoom geographical locations.

CUSTOMIZABLE BASE MAPS
Use leaflet compatible providers like OpenStreetMap, Mapbox for background base maps, or use your own coordinates and your custom base maps.
Let's Start Talking and See How We Can Help