Custom Power BI Map Visualizations
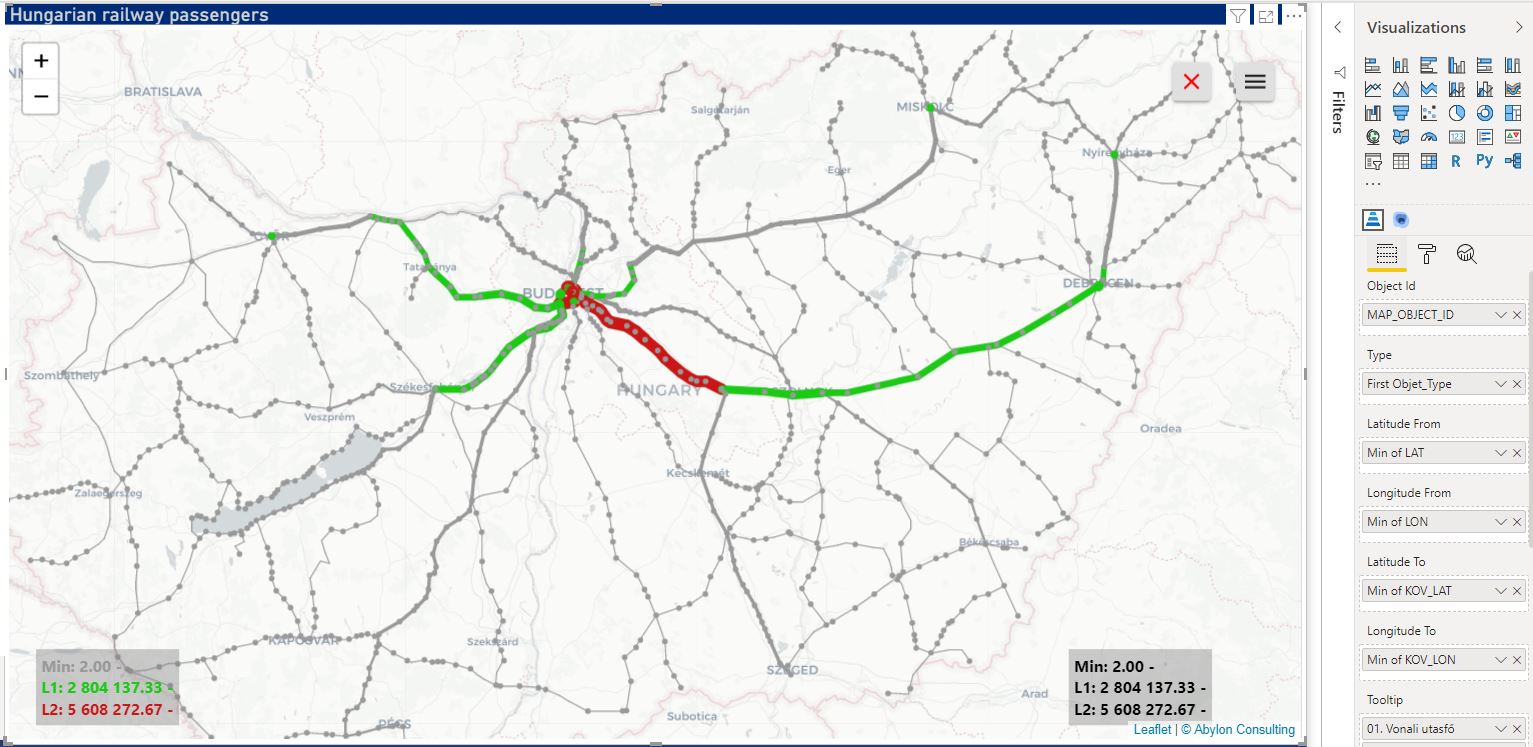
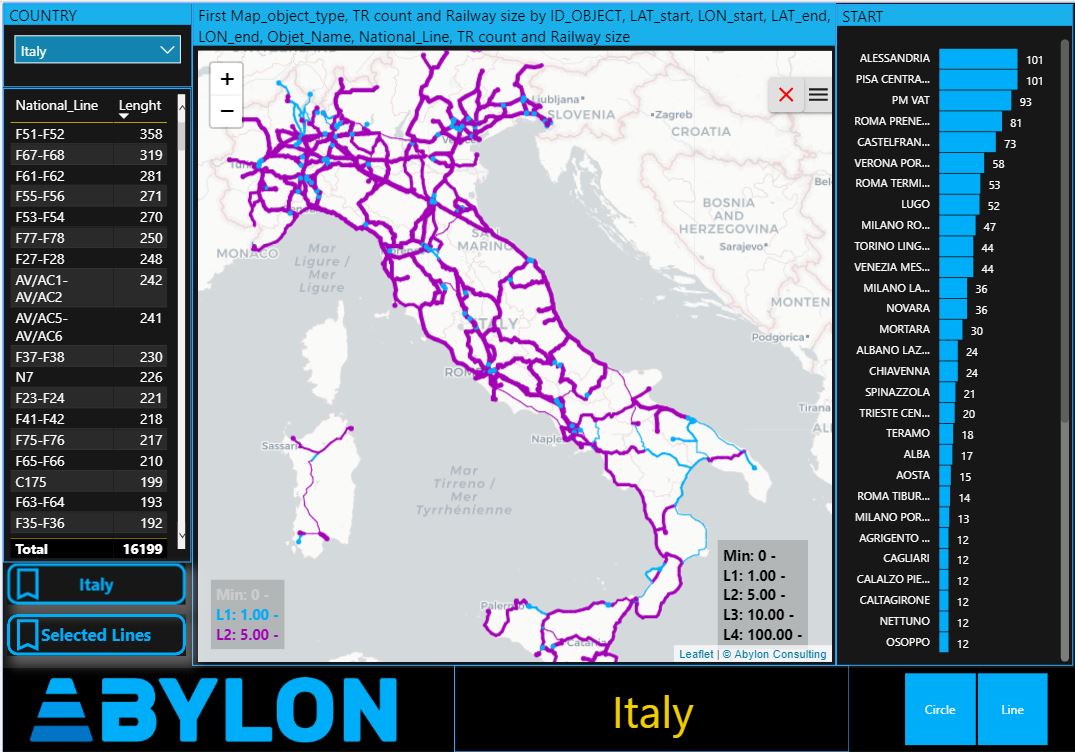
We provide advanced map visualization on top of Power BI for some of the most complex infrastructure providers. Our Power BI custom map solution gives analysts an easy tool-set with domain specific visualizations to make your data speak in the context of our customer’s line-based physical infrastructure.
Benefits of Abylon MAP Visualizations
INFRASTRUCTURE-SPECIFIC VISUALIZATIONS AND DATA MODELS
ACTIVE MAPS BASED ON POWER BI MODELS OR GEOJSON URL
DISCOVER HIDDEN PATTERNS AND WHAT IF ANALYTICS
GIVE DATA MEANINGFULL CONTEXT FOR EFFECTIVE ANALYTICS
INFRASTRUCTURE-SPECIFIC VISUALIZATIONS AND DATA MODELS
ACTIVE MAPS BASED ON POWER BI MODELS OR GEOJSON URL
DISCOVER HIDDEN PATTERNS AND WHAT IF ANALYTICS
GIVE DATA MEANINGFULL CONTEXT FOR EFFECTIVE ANALYTICS
Advanced Power BI Maps
- Visualization of linebased networks using coordinates in the data model or external GeoJson layer descriptions
- Visualization of locations (e.g.: railways stations) on top of the line-based infrastructure
- Selection engine for interactivity and cross filtering inside a Power BI report
- Flexible rules for colors / widths – from easy-to-use automatic rules to fully customizable DAX based calculations
Main Features of Abylon MAP

USE CIRCLES AND LINES FOR OBJECT TYPES
Use multiple object types (circles and lines) at the same time. Select circles or lines with interval (from-to) , drill down from areas, divide lines by direction, use geojson files for lines, points, areas and much-much more.

MULTIPLE POINT & ROUTE SELECTION, MULTIPLE LAYERS
Select multiple routes at the same time or search for and zoom geographical locations all inside Abylon MAP. Use multiple layers simultaneously, ror example: Layer 1-2 – regions with two aggregated KPI’s, Layer 3 – line or circle based map.

EASY-TO-USE PARAMETERS FOR DIFFERENT COLORS, WIDTHS
Coloring, line-weighting and circle sizing by measures, all at same time. Multiple types of calculation methods of weight and colors: linear calculation, manual or color scale.

NO DEVELOPER SKILLSET REQUIRED
Using Abylon MAP requires no developer skills. This easy-to-use approach, combined with the rapid implementation, allows for a super quick go-live.

COMPLETE CROSS FILTERING INSIDE POWER BI
Power BI filters the visualization inside Abylon Map layers. Search for and zoom geographical locations.

CUSTOMIZABLE BASE MAPS
Use leaflet compatible providers like OpenStreetMap, Mapbox for background base maps, or use your own coordinates and your custom base maps.


