Advanced, custom map visualizations for Power BI
Abylon MAP is built on top of Power BI offering advanced map visualization features exceeding any of the out-of-the box solutions. It’s ideal for companies dealing with line-based infrastructures who are looking for an affordable, customizable, easy-to-use map visualization tool for Power BI.
- Infrastructure-specific Power BI map visualizations
- Visualization of line-based networks using both circles and lines
- Full integration with Power BI (built on top of it)
- Active maps based on Power BI models or GeoJSON
Interested? Have a question? Book a presentation today!
Flexible and Affordable
Power BI custom maps
You need point-to-point routing, line logic selections? Or advanced map visualization like detailed routes and objects , or navigation between areas and complex area hierarchies?
You need Abylon MAP!

Abylon MAP is a must-have for companies dealing with complex line-based infrastructures.

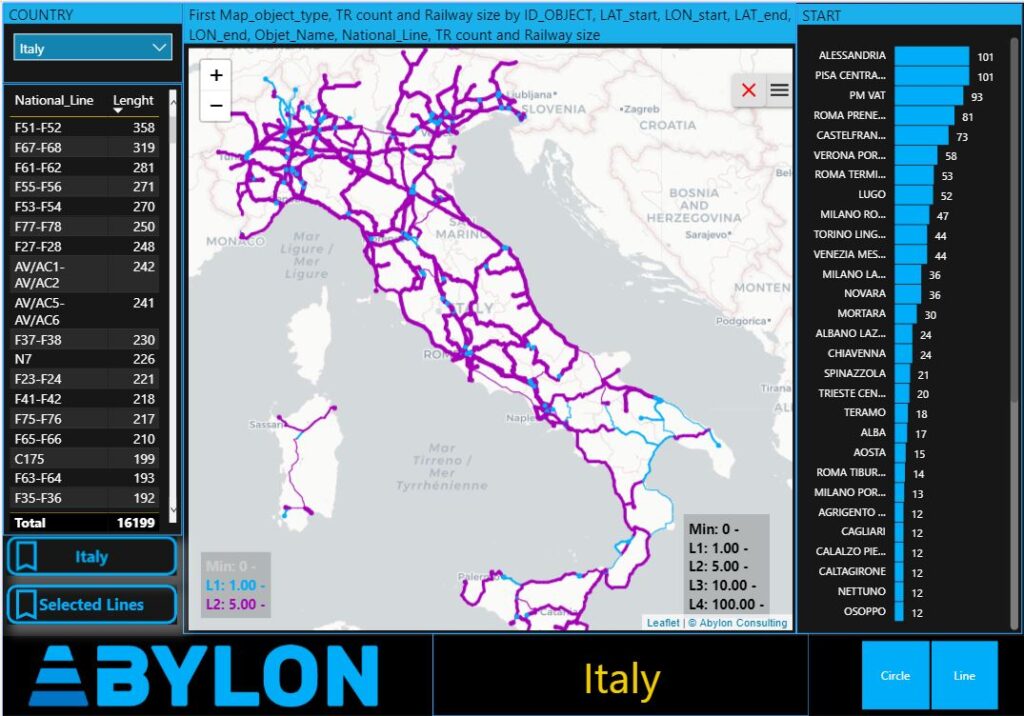
USE CIRCLES & LINES AT THE SAME TIME
Select circles/lines with intervals, drill down from areas, divide lines by direction, use geojson files for lines/points.

FLEXIBLE RULES FOR COLORS AND WIDTH
Coloring, line-weighting and circle sizing by measures, all at same time using multiple types of calculation methods.

MULTIPLE POINT & ROUTE SELECTION
Select multiple routes at the same time or search for and zoom geographical locations.

CUSTOMIZABLE BASE MAPS
Use OpenStreetMap, Mapbox for background base maps, or use your own custom base maps and coordinates.
Typical use-cases
Abylon MAP is an indispensable tool for Transportation (Railways, Shipping, Public transportation), Energy and Utility (Pipes networks, Electricity networks), Teleco and Government companies dealing with complex, line-based infrastructures.