My journey with Databricks as a non-engineer
Quick Intro
Let me begin by outlining what you can expect from this article:
- Get to know some basic concepts about Databricks
- Get excited about trying it out
- Not being afraid about jumping on the Databricks wagon 😅
The article reflects on my personal Databricks experience, so, if you are a deeply technical data engineer, data scientist, architect (basically what I’m not) …etc this article will not satisfy (completely) your knowledge needs 🫤
My journey began when I joined a project where the middleware stack was mostly in an On-prem SQL and visualized in Power BI (with a lot of analysis done on Excel extracts). Essentially any tools available at the time for automation and analysis (including even VBA and low-code platforms like Power Platform).
PS: Another area where I lacked prior experience was DevOps and Git 😅 (I knew what they used for, I saw the interfaces, but had never actually worked with branches, commits, pull requests and all the other magics of DevOps).
My approach when I have to “learn” a new tool, is always first to have a paragon in mind with my available tech knowledge and position my duties in the new stack, so…..
What To Expect When Working With Databricks
The simplified and hopefully approachable description of what you can expect from working in Databricks:
If you are coming from an on-premises world, Databricks is like having a huge data park with a lot of servers, with different kind of hardware configurations, that you can turn on and use on demand (clusters).
From a data perspective, it’s perfect for data engineers, data scientists and data analysts or even business users who have some SQL knowledge or that can specify their needs in a clear way. Important to mention, that yes, it has its own AI assistant built in, and it works pretty well.
The UI of course is modernized, but from a logical point of view, you will be doing the same things as before but only called in another way: like Medallion Architecture.
Which is like a 2006 ODS, or you can look at the first “layers” like staging layers in a previous architecture.
What I Like About Databricks
- Speed
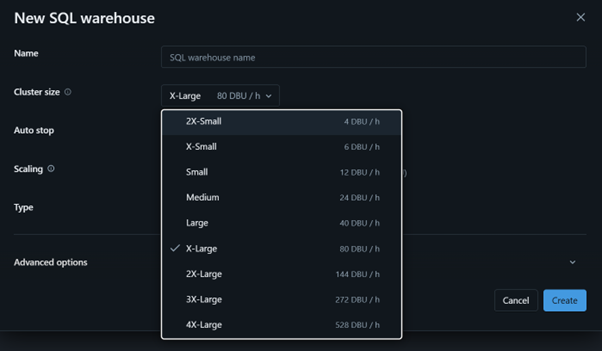
t’s fast. Really fast. Of course, this depends on the cluster size—as with any similar cloud stack.
A quick example from a data analyst perspective: a well-optimized star schema model, which source is an on-prem SQL, queried 400–500K rows of data to Power BI in about 10–20 minutes. An even more complex model, connected to Databricks in the same 10–20 minutes queried 100 million or even billions of rows to our handy dataviz tool.
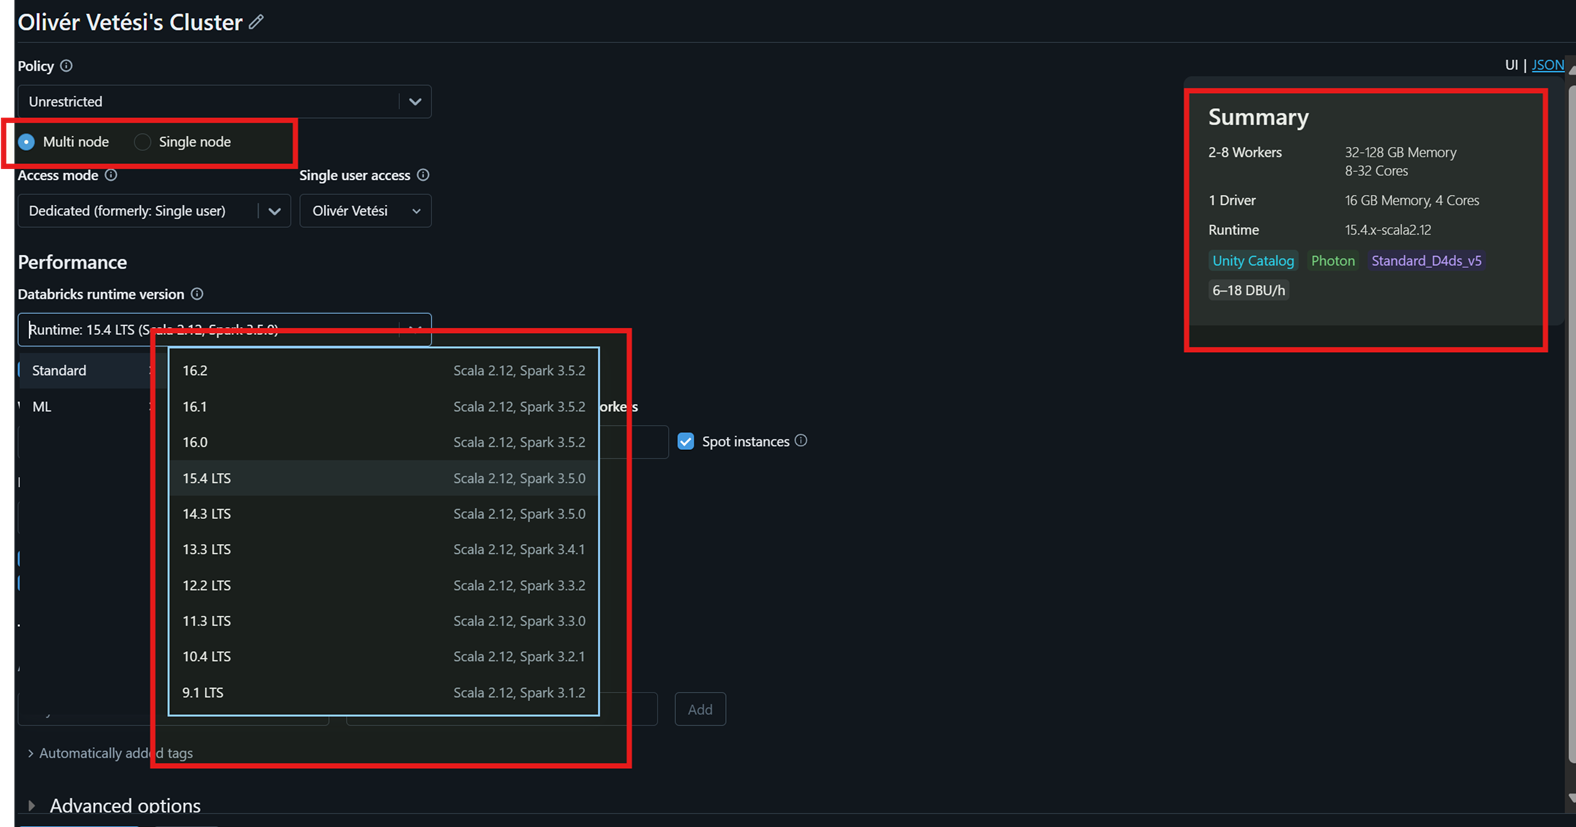
- Serverless Cluster
Think about it like next to your own server park, there is Databricks’ building with 0-24 running machines, and that if you need to run queries/jobs, you knock on their door, and you get to use any of them in a couple of seconds time (no need for long startup). From a Power BI perspective for example, it is mostly enough to connect to a serverless cluster to get the data for the reports.
- Unity Catalog
The Unity Catalog is fantastic! It allows you to see details and metadata on a field level, and makes it easier to trace back the source of it. You can have Databricks draw out an easily understandable graph showing how one table impacts your built pipeline.
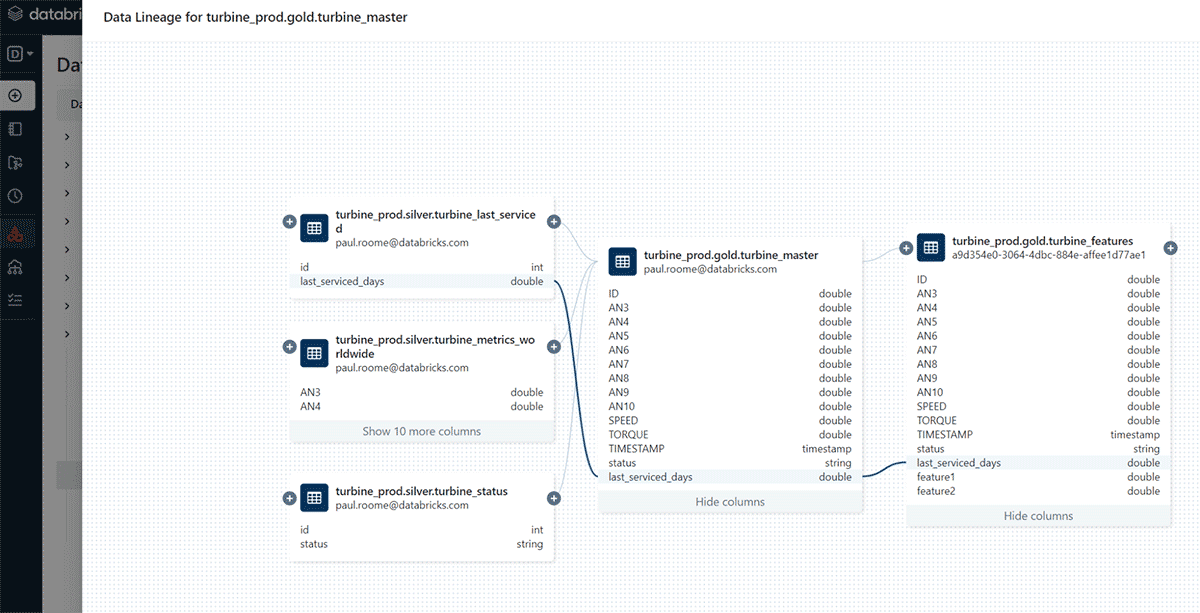
An additional feature of the Unity Catalog is the search bar. I love it! You can search for words, and it shows you in which schema, table, notebook etc. that word is present. For example, if you need to rename a field, you can identify on-the-fly, where to do it.
- Notebooks
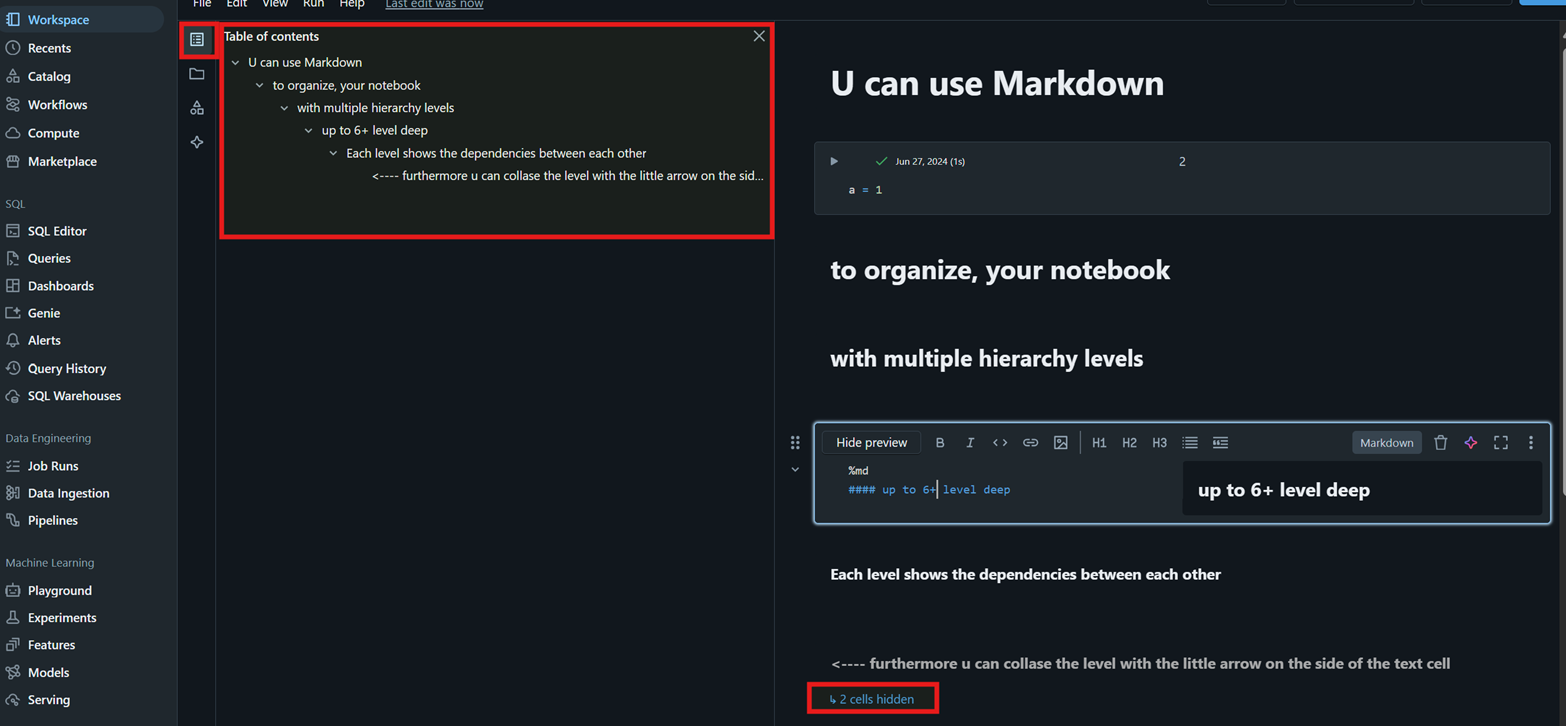
For me it was a new “concept”, but my slight OCD loves the option of having folders, notebooks, and that within those I can use text boxes (in Markdown) and content navigation…etc #tidiness
- AI Assistant
As mentioned earlier, the AI assistant works pretty well. While a sense check is always advised, it can be highly helpful in improving efficiency. Here are a couple of examples:
- I had to create a lot of Views (23), which core function was to have the Database “technocrat” field names, renamed in a way that it would be more pleasing for business users and easily readable (reporting purposes). My approach was the following:
- For each view in the notebook, I created 1 text cell containing the name and explanation (so it’s easy to navigate in the notebook)
- 3 code cells: 1 with a “describe table”, 1 with the create view, 1 with a select top 10 from the created view
- I’ve run the describe table, and copy pasted the results in the “create view cell”
- Added a prompt to the AI assistant in the code cell, asking it to add all the commas before the field name, and giving aliases to all the fields which weren’t “ID” fields.
- Run the created view cell and run the next cell for a quick sense check.
- As I mentioned at the beginning, I am not a data engineer, neither a data scientist, but I think I can specify technical needs quite well. I wanted to check some Json and CSV file in the bronze layer, whether the data that I was seeing in my PowerBI report, was correct. Road blocker faced: I can script SQL but not Python, so I quickly asked the AI assistant to help me create the Python code, with the filters that I wanted and visualizing it in a table view so that I would be able to run through the results.
- In the last place, here comes what is I think the most “relatable”:
Imagine you’ve had a long day, jumping back and forth between meetings and developing a script. It’s already after standard workhours, but your professional pride whispers in your ear:
“you can do it, only a couple of tweaks on that 1 code cell, and you can close that topic”.
You add the mentioned “tweaks”, and you press run, but the run fails, because somewhere a bracket wasn’t closed, or a comma was missing or who knows what else. My life before Databricks: I would check the code line by line, trying to spot what I’ve messed up. Now I simply write to the AI assistant “/Fix it”.
- Visualizations and Dashboards
Yes, you can create these, and furthermore! If you have for example an SQL query that has given you the desired results, you can ask your trusty friend (AI Assistant) to visualize the data and voilá in a couple of seconds you get a simple visualization. Where do I find this helpful?
- For business users with some SQL knowledge who don’t want to spend time building reports in Power BI but need a pie chart, stacked bar, and so on for a presentation.
- Perfect for replacing simple KPI visualizations in territories where interaction and UX note is needed, such as IT Operations, where usually they use additional free open-source tools such as Grafana in order to have a cost optimization (no need for license fee payment💸).
- Note: At the moment, Databricks visualization, in my opinion, is not suitable for full-fledged executive reporting, where various tricks have to be implemented in order to have a specific visual interaction and UX/UI built. It’s more appropriate for data analysts or at least people comfortable with seeing some code lines.
What I Don’t Like
- Waiting for a cluster to start up (this can take up 5-10 minutes).
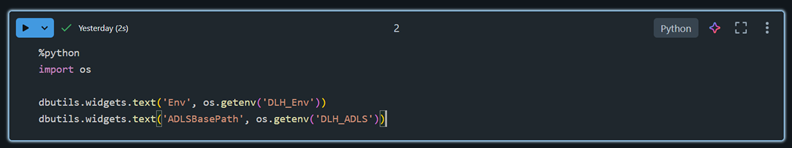
- Needing a cluster in case of “Environment” parameterization (dev, test, prod), since reading the actual environment is currently only possible using Python (unfortunately, you can’t run Python on a serverless cluster).
- It would be helpful to have a clearer view to see differences between branches side by side (not only code but also folder structure changes renamings), on the Databricks side, instead of realizing these differences only on the Git/Azure DevOps side after the commit.
Coming Up Next: Databricks Genie
Stay tuned for my next article on this topic, where I’ll cover Databricks Genie—what it is, what I like about it, and where I think it could improve.
What is Genie in one sentence?
Genie is Databricks’ AI assistant, designed to help users across various roles (data analysts, engineers, scientists, and business users) interact with their data using natural language
Taking The Next Step with Databricks
Ready to transform your data capabilities with Databricks? Check out our Databricks QuickStart Packages or get in touch with us for a quick free consultation.
We’re here to help from your first steps to full deployment.
Other popular related blogposts:

Author of the post:
Oliver Vetesi - Engagement Manager at Abylon Consulting. Linkedin Profile