
Why Finance Professionals Are Closer to BI Than They Think

I assume many of you (just like I did in the past) think that people working in Business Intelligence or Data Analytics are software developers writing complex code and working with databases all day.
Let me clear up that misconception right away.
If you work in finance, whether as an FP&A Analyst, Controller, or Business Partner, there’s a good chance you’re already doing work that is very similar to what a Data Analyst does.
You might be thinking: “What is the connection between finance and data analytics?”
What if I told you that you are already:
- cleaning data
- doing basic data modeling
- analyzing datasets
- collaborating with stakeholders
Not convinced yet?
Let me explain in 4 steps.
What Are You Already Capable Of?
1. Cleaning Data
I am pretty sure that you have a messy Excel file somewhere that comes from one of your stakeholders.
Maybe it looks like this:
Retail_Sales_final_recalc_v3.xlsx
Sounds familiar?
Your job is to extract what you need, clean it, and reshape it so it fits your reporting structure. At this point, you probably know the 20 steps required to clean the file. You’ve done it so many times that you don’t even need documentation anymore.
What you are doing here is data preparation, which is one of the core tasks in any data analytics workflow.
In BI projects, a significant amount of time is spent exactly on this: cleaning, transforming, and structuring data before it can even be analyzed.
So, if you regularly prepare messy datasets for reporting, you are already performing an essential data analytics task.
2. Data Modeling
When you transform data into Excel, you are often building mapping structures.
For example, when I maintained reports in Excel, I had several mapping sheets: product mappings, cost center mappings, or account hierarchies. Sometimes these mappings were even stored in separate Excel files.
In BI, these are called dimension tables.
When you use VLOOKUP or XLOOKUP to retrieve attributes from a mapping table, you are essentially connecting two datasets together.
In BI tools, this is done through relationships between tables, but the underlying concept is exactly the same.
So even though it may not look like it at first glance, many finance professionals are already working with simplified forms of data modeling in Excel.
3. Analyze: finding patterns, risks
Once the data preparation is done, the real work begins.
Because you are familiar with the business, you can identify patterns, risks, and discrepancies in the data.
This is one of the biggest strengths of finance professionals because you are interpreting them within the context of the business.
A data analyst might see numbers changing. A financial analyst understands why those numbers are changing.
And that makes your insights much more valuable.
4. Working with Stakeholders
If you work in finance, you are already used to:
- monthly reviews
- quarterly business reviews
- budgeting cycles
- forecasting discussions
You know how to present results to business stakeholders and explain what the numbers mean.
And this is your second major advantage: you understand the business behind the data.
You know how managers think, what questions they ask, and which metrics matter in decision-making.
That ability to translate data into business insights is extremely valuable in BI projects.
What Finance Professionals Are Already Doing?
If we look at the daily work of many finance professionals, it often includes activities such as:
- consolidating large Excel datasets from different sources
- building pivot tables to analyze performance across multiple dimensions
- creating charts or dashboards for management reporting
- preparing recurring monthly or quarterly reporting packages
- improving or automating existing reporting processes
- presenting insights to management
When you look at it this way, the overlap with Business Intelligence becomes quite obvious.
Consider the following parallels:
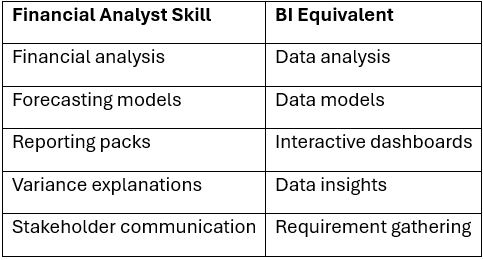
So, in many cases, finance professionals are already doing work that is very close to what BI analysts do.
Most of the difference comes down to the tools.
The Real Learning Curve: Tools and Data Modeling
At this point, you might still be wondering: “Okay, but what about the technical skills?”
Here’s the good news.
For most finance professionals considering BI, the main learning curve is not analytical thinking or business understanding. Those capabilities already exist.
The real challenge is getting comfortable with new tools and concepts.
Modern BI platforms such as Power BI or Tableau allow analysts to build interactive dashboards and structured data models.
Working with these tools introduces concepts such as:
- data transformations
- relationships between tables
- query logic
- data modeling principles
- visualization design
At first, these concepts might feel unfamiliar, especially for people who have worked mainly in spreadsheets.
But many finance professionals already have the analytical mindset required to learn them.
Anyone who has built complex Excel models, managed large datasets, or optimized reporting workflows already has the discipline required for structured data work.
The transition often involves shifting from thinking in spreadsheets to thinking in data models.
Once that shift happens, many aspects of BI start to feel surprisingly familiar.
A Bridge Between Finance and Technology
The relationship between finance and BI is not about replacing one discipline with another. Instead, it represents a bridge between two worlds.
Finance provides the understanding of business performance, financial logic, and decision-making needs. BI provides the technical framework that transforms raw data into scalable analytical systems.
People who understand both sides are extremely valuable for an organization. They can translate business questions into technical solutions and make sure that analytical tools support real-world decisions.
As companies increasingly rely on data-driven decision-making, this hybrid skill set becomes more valuable than ever.
And for many finance professionals, the starting point is closer than they might think. Often, the transition begins with something simple: curiosity about a better way to work with data.
What Comes Next?
In this first article, I wanted to show that many finance professionals are already working with data in ways that are very similar to Business Intelligence.
But a natural question remains:
What technical skills do you actually need to move from finance into BI?
In the next article of this series, I will walk through the most natural transition path many finance professionals take:
Excel → Power Query → Power Pivot → Power BI
We will start where most of us already are: Excel.
And you might be surprised how many BI concepts you have already been using without realizing it.
If this got you thinking, follow Abylon on LinkedIn to keep up with new articles.

Author of the post:
Máté Csomós - FP&A & Data Analytics Specialist in before, now BI Developer at Abylon Consulting. Linkedin Profile