
Data Masking in Power BI in 2025 - Part 2
Introduction
Welcome to the second part of our series on Data Masking in Power BI. In Part 1, we delved into the fundamentals of data masking, exploring how Power BI handles data through Direct Query, Import Mode, and Direct Lake. We also examined the roles of report builders and users, and discussed the impact of source-level data masking on report security.
In this continuation, we will explore both native and creative data masking solutions within Power BI, providing practical insights and techniques to enhance your data security strategy.
Table of Contents
Native Data Masking Solutions in Power BI
In case of Native data masking, we have 2 options in Power BI (like a lot of database solutions)
Object Level Security (OLS)
Object-Level Security (OLS) is a feature that enables you to control access at a granular level within a Power BI model. This means that specific tables, columns, or measures can be hidden from users based on their roles. By implementing OLS, organizations can enforce strict governance over which data elements users can access, thus enhancing data security.
How OLS Works
1. Defining Object-Level Security:
- OLS allows administrators to create security roles that define specific objects (tables, columns) that are accessible to users.
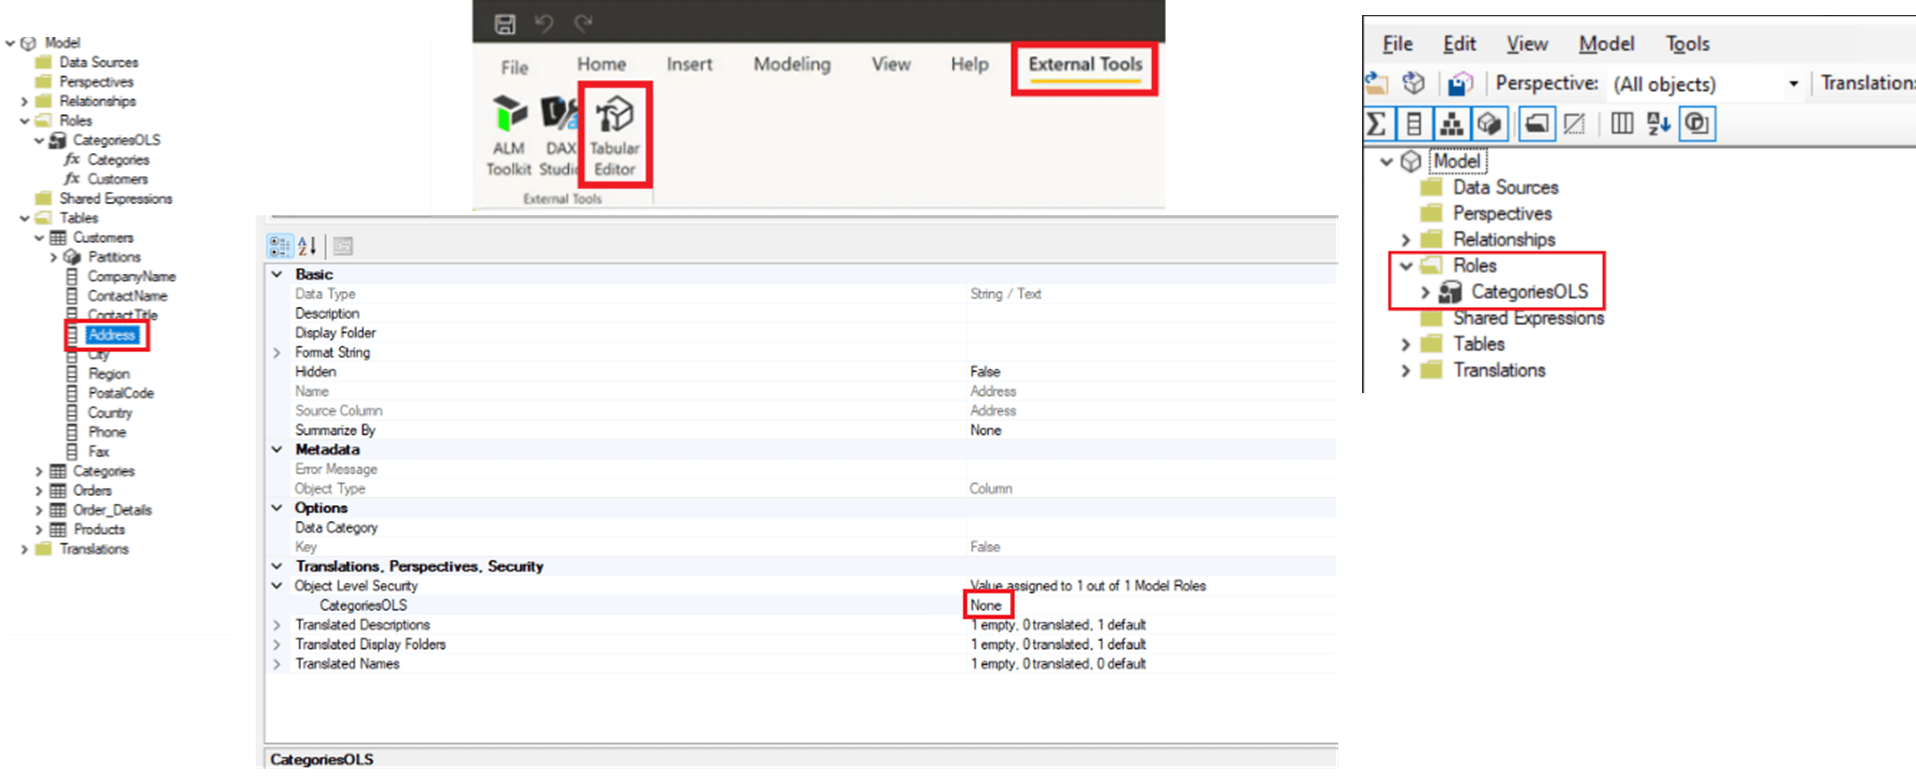
- You can utilize tools like the Tabular Editor to set up OLS more easily than through Power BI Desktop alone.
2. Assigning Roles:
- Users are assigned roles that dictate which elements of the data model they can view or interact with.
- For instance, a legal department might have access to sensitive legal documents while finance users do not.
2. Implementation Steps:
- Open your Power BI model in Tabular Editor.
- Create a new role or modify an existing role to include OLS definitions.
- Specify which tables and columns should be hidden or accessible based on the defined role
Limitations of OLS
- OLS cannot be implanted on a semantic model with already implemented RLS
- It works only for user who has max a “VIEWER” access on the Power BI Workspace
- If a user has VIEWER access on the Workspace and BUILD access on the Semantic model, the OLS works perfectly (and is also inherited in Excel Power query when connecting to the semantic model)
- Workspace Admin, member and contributor access or Semantic model edit access makes the OLS setup redundant since the user will be able to download the model and modify the developed set-up
- In case of Analysis Services, the source OLS is the one in effect on the report
- OLS cannot be set on a table or row where after the setup the Semantic model integrity would be disrupted
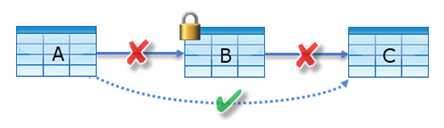
- OLS on table B is possible only if there is a secondary connection defined between A and C table, otherwise an error will be received when saving the OLS
- If there is a fully built report, with various pages and visualizations, the OLS effecting table/rows/measures, make the visualizations containing those restricted datapoints, go into error
Summary
We can say that OLS is more for “build” level users, where a centralized model is built, but is used as a “source” to build personal Report Layouts (or excel pivot analysis), and not for distributing centralized management reports.
Row Level Security (RLS)
Row level security in contrary to OLS, works by restricting access to a semantic model table’s specific rows. This means that we can build reports where multiple users can use the same report but see different data like: A user sees 2 countries data while B user sees 18 countries data.
How RLS Works
1. Defining Row-Level Security:
- RLS is implemented by creating roles within the Power BI Desktop file. Each role contains specific DAX filters that define what data is visible to members of that role.
2. Assigning Roles:
- After defining roles, you can map users to these roles. Power BI uses the user’s identity to filter the data that they can access when viewing the report or dashboard.
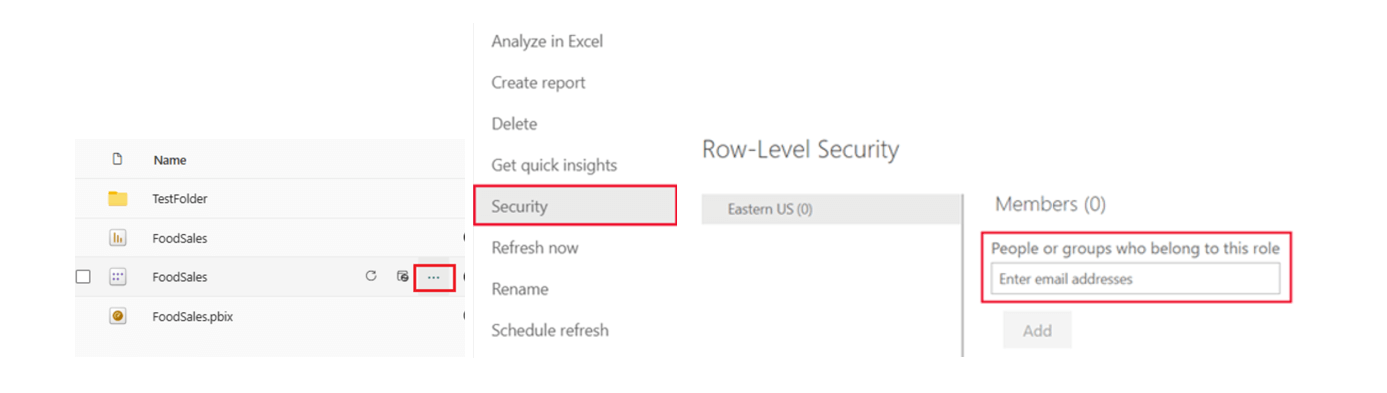
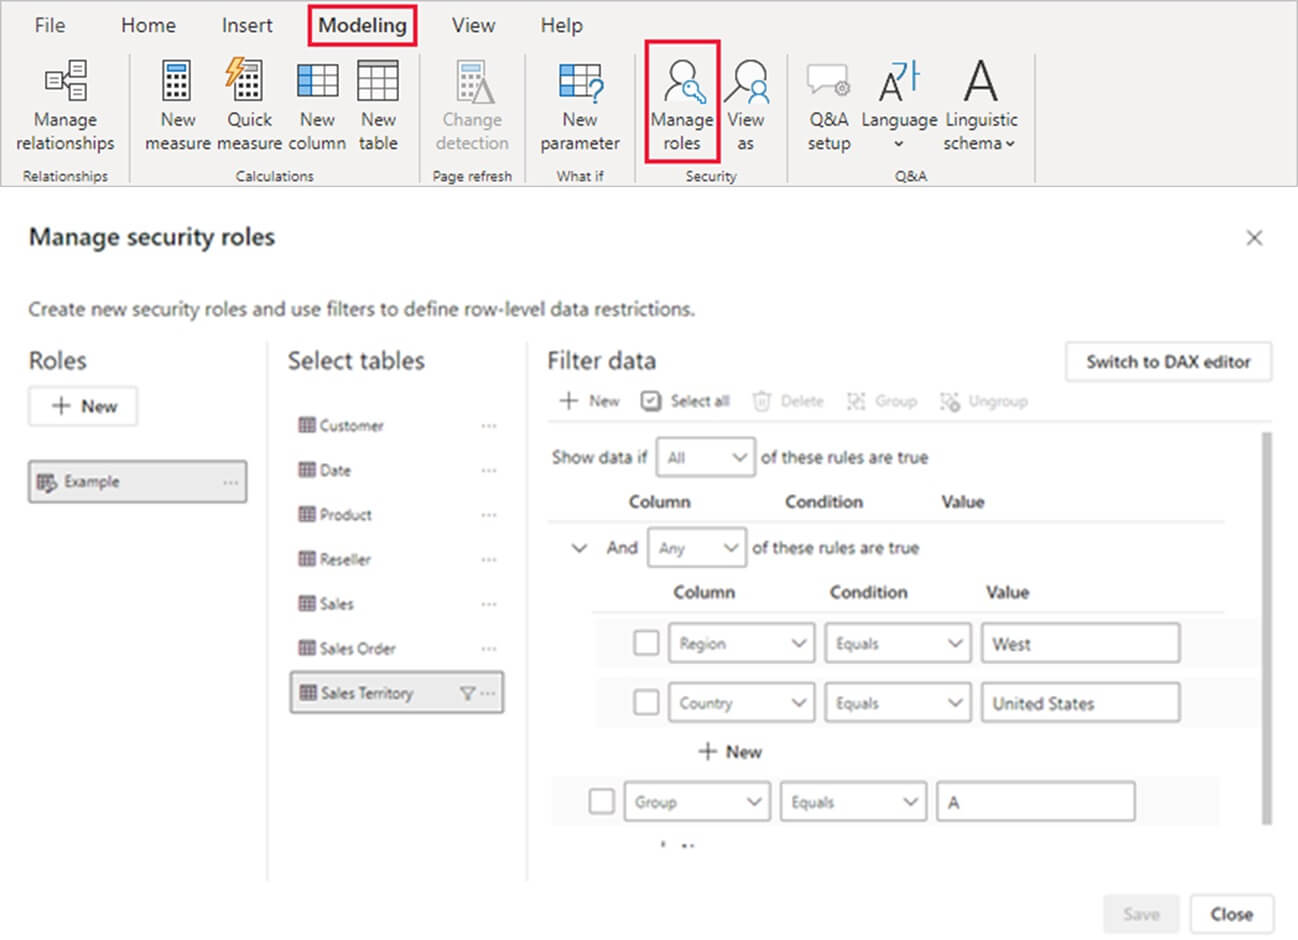
3. Implementation Steps:
- To set up RLS, you typically go to the “Model” view in Power BI Desktop, define your roles, and then specify DAX filters for each role. Once published to the Power BI Service, you can assign users to roles through the security settings of the dataset.
- You can create DAX expressions that filter data based on user attributes, such as their department, geographic location, or any other criteria that suits your organization’s needs
Limitations of Row Level Security
- RLS cannot be implanted on a semantic model with already implemented OLS
- It works only for user who has max a “VIEWER” access on the Power BI Workspace
- If a user has VIEWER access on the Workspace and BUILD access on the Semantic model, the RLS works perfectly (and is also inherited in Excel Power query when connecting to the semantic model)
- Workspace Admin, member and contributor access or Semantic model edit access makes the RLS setup redundant since the user will be able to download the model and modify the developed set-up
- In case of Analysis Services the source RLS is the one in effect on the report
- RLS testing (view as role) doesn’t work in case of DirectQuery semantic models with SSO
- RLS testing (view as role) doesn’t work in case of Paginated reports
Interested in diving deeper into dynamic row-level security? Check out our detailed blog post on “Multi-level Access Rights in Dynamic Row Level Security” where we discuss the complexities and solutions for managing sophisticated access structures. Learn how to effectively implement and manage multi-level access rights to enhance data security and compliance.
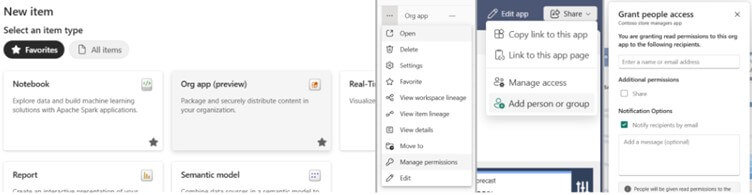
Bonus: Power BI App – App audience
I know the App audience is not a classic “data masking” but that depends on the point of view. 😊
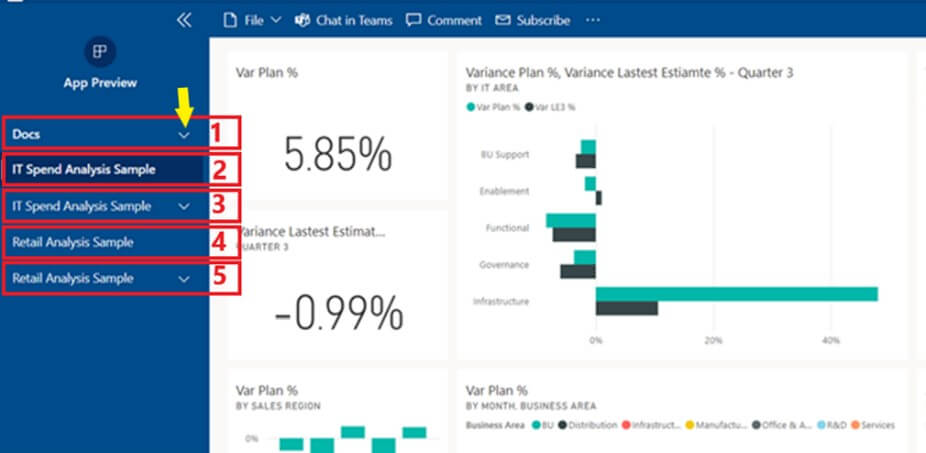
Power BI Apps are a collection of various reports within a workspace, in one consolidated UI. Basically, instead of opening 5 reports in 5 browser pages/tabs, it creates the UX of having the 5 reports on one side navigation panel, and those report pages accessible after opening the related “drop down” icon.
Then comes the “App audience”, which basically allows us to say which user groups which reports can see out of the 5.
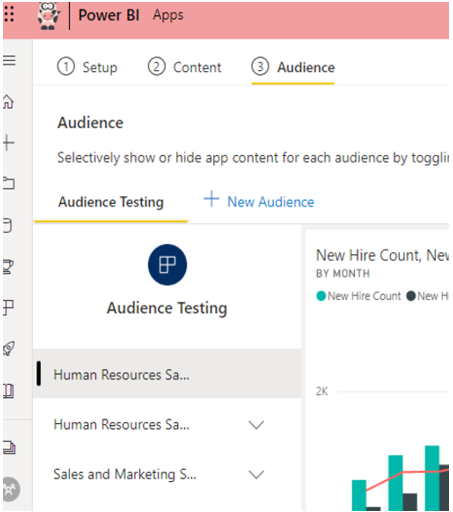
If we look at Power BI Apps from another angle, they can be used to create Data Masking, and even in an effective way, because we can have a semantic model with RLS the other one with OLS and their relative report, plus we can say that out of the 2 reports A audience sees the first one and B the second one.
At the end of the day, from a “report user” perspective it will be perceived as “I have access to the Power BI App”.
Of course we must take in consideration limitations like:
- 1+24 audience can be created per app (1 is the default)
- Multiple reports will be created covering the same topic
- Multiple workspace management is necessary
- App publish and update operations have a timeout of 1 minute. If your app is running into timeout error during update, consider reducing the number of artifacts included in the app.
- A total of 10,000 users and user groups combined can have access to an app.
- Each user group is counted as one entry against the 10,000 total
Note that at the time of writing this article Fabric Organisational Apps is/was still a public preview.
Main difference between Power BI Apps and Organizational apps
Power BI Apps
- It transforms 1 workspace into the app, and only 1 app can be deployed per workspace.
- Only Power BI Items (Reports, Dashboards, Paginated Reports) may be included.
- Limited options for cross-workspace apps.
- Limited options for customization (Limited coloring options, navigation options, Front Page/Landing Page options).
- You need enough Power BI PRO license
While Organizational Apps
- Will allow us to create multiple apps within a workspace.
- Add items from multiple workspaces.
- Wither customization options.
- Adding other types of Fabric items to the app (notebook, real-time dashboard, etc.)
- Ties to MS Fabric Capacity needed.
Other “Data Masking” Solutions in Power BI
In this article section I’ll summarize two ways to create a kind of “data masking” that combine various Power BI report development techniques.
Custom OLS (Hack)
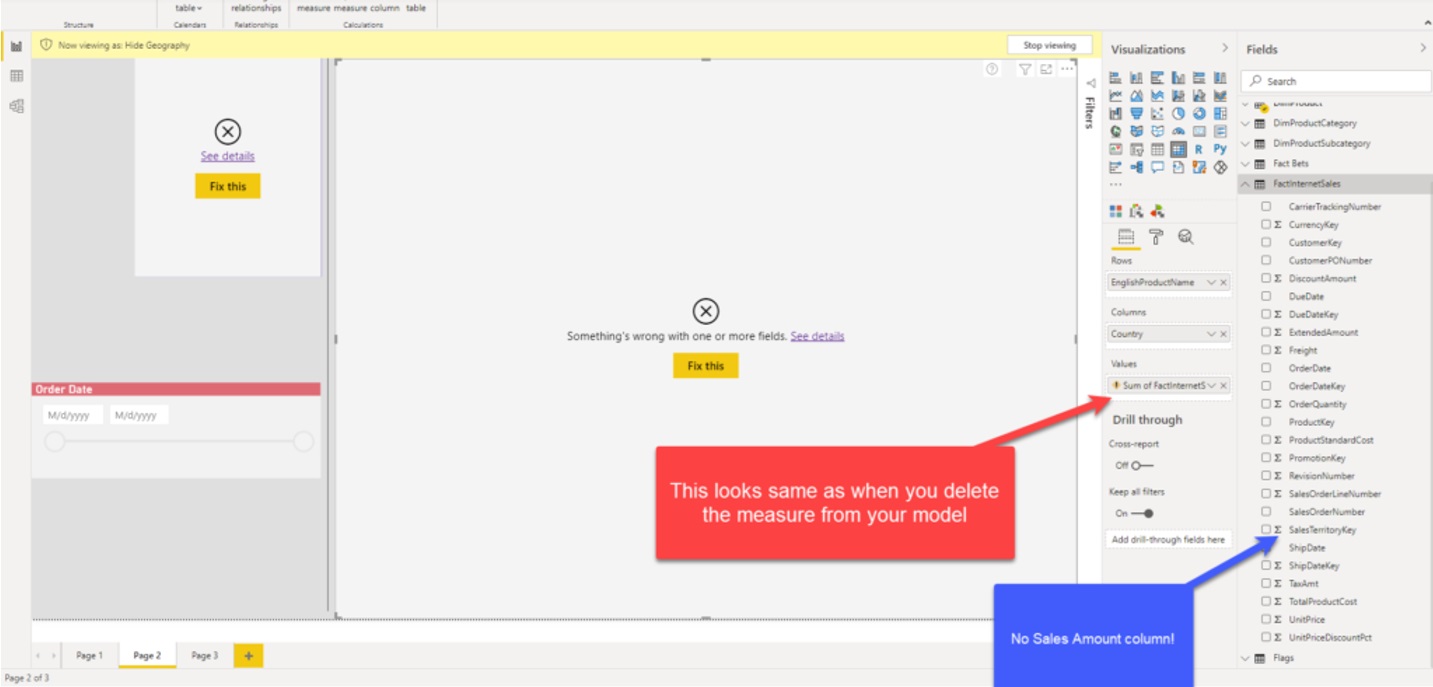
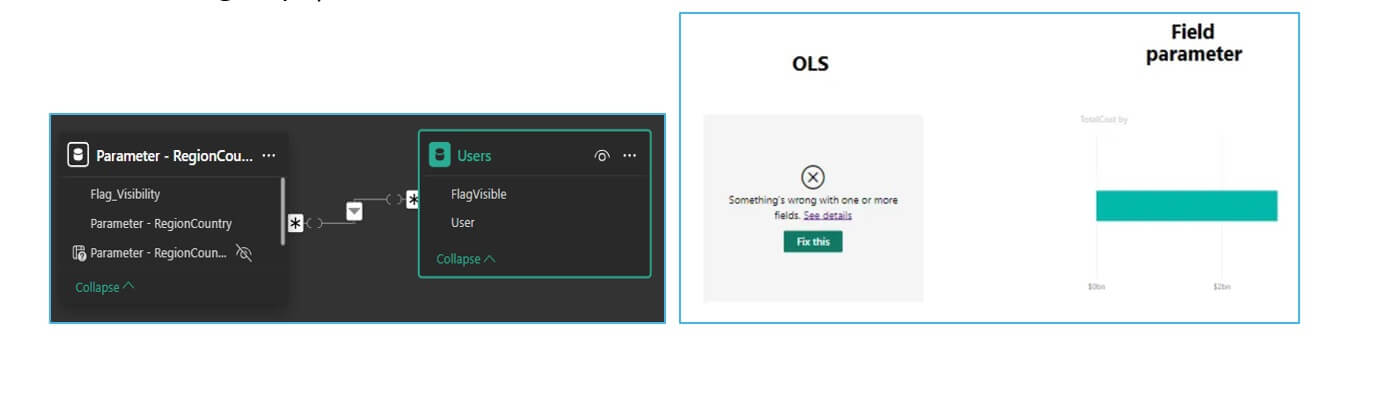
The major issue with OLS is that, in case of centralized BI development, when a report is created to be distributed to multiple users, the Report layout runs into error, if OLS is applied to an object added to the visualizations, hence the user experience is not the best (see below).
To avoid this error and build management reports where the users see different fields in the report/visual, we can implement a “custom OLS” with Field parameters (or calculation groups), and RLS.
Basically, is creating an environment to reference measures or table columns like “rows” and then apply RLS.
This sounds “Fantastic” but where is the catch?
Unfortunately, this creates other types of limitations that we should consider before developing this solution:
- This data masking solution works and is developed on report level
- It’s filtering out the limited objects, on a visual level, and needs to be added via the filter pane on a visual level (page and report level filtering doesn’t work since we need to use measures).
- The solution requires a deeper knowledge of Power BI and sometimes advanced modelling skills.
- The solution development is time consuming.
- And the concept is semantic model and use case specific, so it’s rarely applicable to another report/model.
- The filter pane becomes a not usable report user tool.
- The solution works only for REPORT VIEWERS hence closing out the opportunity to “self-service BI” UX/UI.
- Since the dynamic filtering is done on a visual level the user cannot have “build” rights on the model, because all the report builder-driven UX will be lost.
- The solution is not inheritable to excel power query connection.
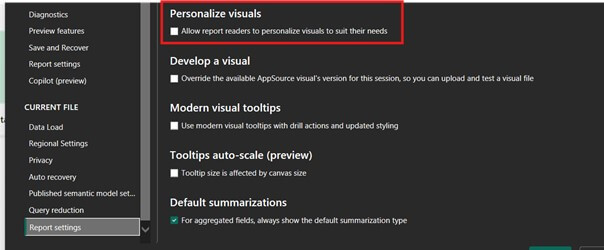
- Published report “personalize visuals” feature cannot be allowed.
Dynamic page navigation
This solution as the previous one, tries to recreate a way to use RLS and other tricks to create a “report builder driven UX/UI”.
How does it work?
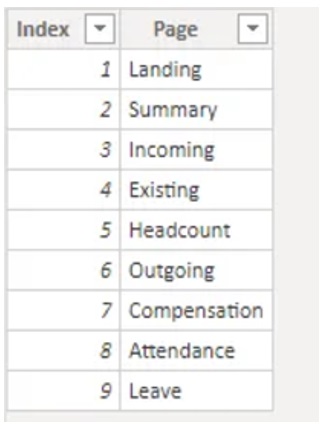
- Here with RLS, we use a “disconnected table” containing, the names of the various Power BI report sheets (in rows)
- By default, the report should start with a “home navigation” page
- The core of the entire solution will be a drop down and a button
- The drop down will contain the sheet names from the disconnected table (The slicer needs to be set up to “single select”).
- The button action will be “page navigation” based on the disconnected table sheet name values
What will happen then?
- Based on the RLS, users will see X amount of sheet pages
- Based on the single selection the table will return only 1 value out of the table already filtered by the RLS
But again…. Of course, this sounds “Fantastic” but where is the catch? Unfortunately, this creates other types of limitations that we should consider before developing this solution:
- Multiple report pages need to be developed in one report, to have “the same page” with 4 KPI and the other with 7 KPI …etc.
- This data masking solution works and is developed on report level (It’s filtering out the report pages only).
- The solution requires a deeper knowledge of Power BI and sometimes advanced modelling skills
- The solution development is time consuming. Plus the concept is a semantic model and use case specific, so it’s rarely applicable to another report/model.
- The solution works only for REPORT VIEWERS hence closing out the opportunity to “self-service BI” UX/UI.
- Since the dynamic filtering is done on a report level the user cannot have “build” rights on the model, because all the report builder-driven UX will be lost.
- The solution is not inheritable to excel power query connection.
- Published report “personalize visuals” feature cannot be allowed
Conclusion
Implementing effective data masking strategies in Power BI is crucial for maintaining data confidentiality while ensuring robust analytics. By leveraging native solutions like Object-Level Security (OLS) and/or Row-Level Security (RLS), as well as creative, non-native approaches, organizations can tailor their data protection measures to meet specific needs.
We encourage you to explore our other blog posts on Power BI, Row-Level Security, and Business Intelligence to further enhance your understanding and application of these concepts.
Other popular related blogposts:

Author of the post:
Oliver Vetesi - Engagement Manager at Abylon Consulting. Linkedin Profile