Introduction
Advanced Data Analytics and Data Science is a really hot topic right now and it’s something definitely for the future as well. In 2020 the global data science platform market was valued at USD 31.05 billion, and it is expected to reach USD 230.80 billion by 2026, registering a CAGR of 39.7 % during the forecast period, 2021-2026. Impressive numbers, but how does it affect your life? Data is getting more and more important in nowadays world, and even you can play an important role in its expansion.
Since you clicked on this post it’s clear that you are interested in data analytics. Maybe you’re interested in the technical side (as a tech expert), or in the results of data analysis (as a manager) or you are just simply curios about this topic.
You would like to start working with some data, but your company doesn’t have the data infrastructure and the workflow for that yet. You’re not the only one who’s in this situation. As data science is going viral, more and more companies are realizing its benefits and thinking of investing in it on long term, but they don’t exactly know how to create a complete framework around cool buzzwords like “Python, ML and AI”.
In this article we describe how to create one. Since we have a lot of experience in working with industry-leading Microsoft products, in this example we are going to show you a setup that is based on the Microsoft cloud architecture, which is already tested, implemented and operated on a daily basis.
At Abylon Consulting we’re crazy about data, so if you like this topic browse through our blog for some other data analytics related posts and guides, or check out our product or service offerings if you are looking for a solution for your company.

What are my essential goals?
- I want to work with Python/R/spark, since I know they are interesting and very fashionable nowadays. I mastered basic SUM, COUNT, AVG Excel functions long ago, I want something way more sophisticated.
- I’m interested in more massive datasets: even public dataframes from the internet, even internal database tables or corporate files.
- I want to visualize my results on good-looking reports, spiced with some automations.
- I want to have a complete infrastructure that is robust and simple at the same time
This rigid infrastructure was not suitable for advanced analytics which requires dynamic data and an option for self-service business intelligence (BI). Furthermore, our client has other BI solutions that would also require this type of dynamic data.
Introducing the components of our Advanced Analytics Platform
Power BI (PBI)
- Possibly you are already familiar with Microsoft’s industry-leading data visualization tool.
- If you like charts, filters, plots, you will feel home. Call it a well-balanced mixture of Excel, Power Point and SQL.
- Though it’s not placed in MS Azure, you will need it to create beautiful and informative reports.
Azure Databricks (DBX)
- A Jupyter notebook-like interface which does the core data analysis and processing.
- You can write scripts in Python, R, Scala, and even SQL. Supports Apache spark also.
- It runs in the cloud, you don’t need to install any distibutions/libraries/etc on your computer.
- Scalable compute resource, scalable cost (flexible and predictable, pay as you go)
Azure Datalake Storage (ADLS)
- The cloud storage you will use. Simple, but very useful, consider it as a more strict OneDrive or Google Drive.
Azure Data Factory (ADF) – optional
- If you need scheduled data copy from external/internal source systems, ADF will possibly be handy.
- It is responsible for data movement activities in the cloud, or even on-prem.
High-level design
- First, you need to have some source data stored on the ADLS to begin with the analysis. Don’t worry, you can upload any flat files (like csv, json, xlsx) from your computer, there is no need for ADF at the moment.
- You will consume & analyse this data with DBX, and store the output on the same ADLS.
- If your analysis is done, and the result data is available on the ADLS, it’s time to open up a PBI file, and bind the necessary data from the source file(s) of the ADLS.
- If you are finished with report development, you can publish your report to PBI Online, and share it with anyone.
- If you have build a solution that is time-dependent, and needed to be refreshed from time-to-time, you can automate the execution of the DBX and the refresh of the PBI report in the cloud.
- If not only the calculations are time-dependent, but source data should also be refreshed, it’s time to add an ADF. With ADF, you can schedule data loads from source to sink (ADLS), plus DBX notebook executions can be triggered as well
Implementation
Azure tenant
To get all of that, you need to have az Azure tenant and an Azure subscription. You can try it for free for 12 months and you can use a credit of 200 USD in the first 30 days.
Resource Group
After the registration, create a new Resource Group (RG) which functions as a box to store your things. It doesn’t cost any money, it is only a simple “folder” in your subscription.
DBX
Create a new Azure Databricks (DBX) workspace, within this RG. Lauch the workspace, and take a look around there. You can find the menu options on the left, and maybe the two most important options are Workspace and Compute.
- Workspace stands for a folder structure for your executable Jupyter notebooks (ipynb format), while
- Compute holds all the compute resources (clusters), which execute your code in the notebooks
You will have to create a cluster prior to any development. You are charged by cluster time usage, so you are supposed to optimize the runtime and not leave any idle time. You can pick whichever setup fits you and your budget best.
Check this deeper guide with a case study if want to dive in DBX Python coding. Remember, core coding will be done here in DBX, all other components only help you with connectivity, data freshness, and robust operation. If you wish to try DBX alone at first, you can do it without creating any other resources. But, for a complete platform, you will need other components as well.
ADLS
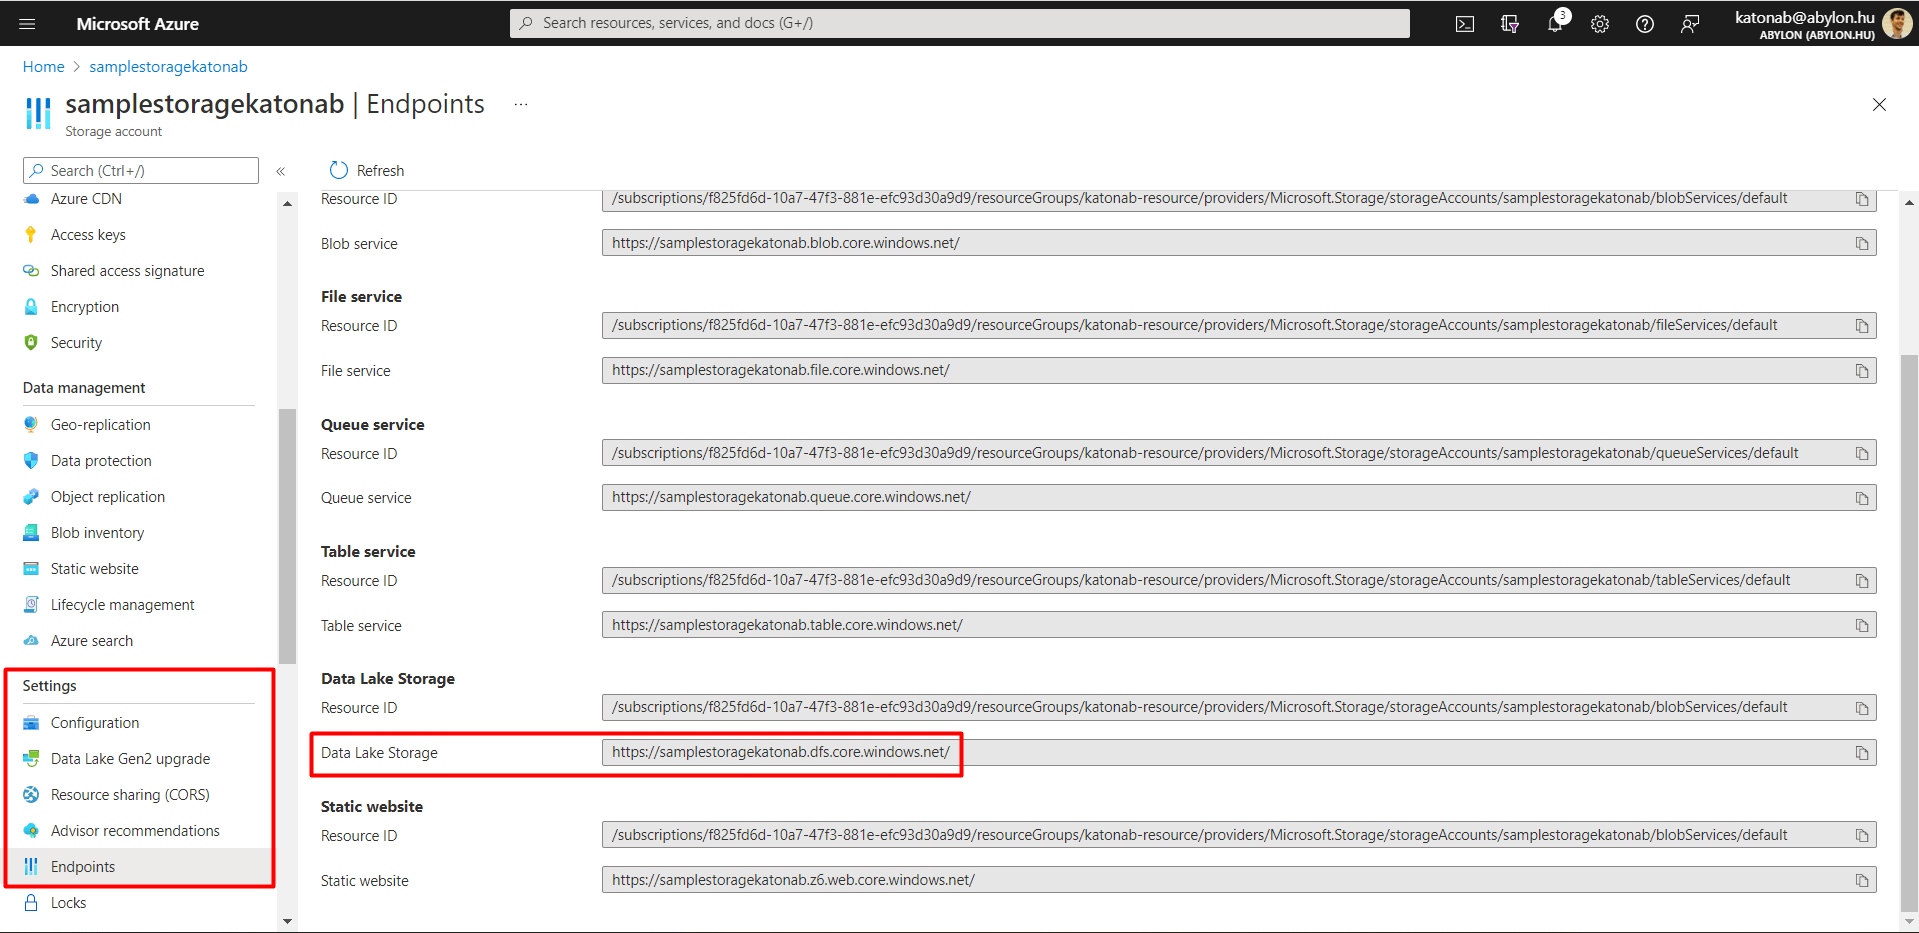
Create a new Storage account (ADLS), also within the same RG. At Settings/Endpoint blade (left-side menu options are called “blade” in Azure) you can find the links to this specific ADLS, use this link when you aim to connect to this from PBI.
Connect ADLS with DBX
To make these two resources communicate with each other, it is needed to create a bridge between them. The best solution is an OAuth 2.0-based solution, named Service Principal (SP). This SP is an Azure Application, that creates the bridge between the two components, providing authentication from and to both parties.
The recommended option is a mount point, which is basically a link to a container of an ADLS, that the DBX notebooks can use as a link to point directly to the files placed on the ADLS.
Having a working SP provides a rather dynamic communication between the two parties allowing you to quickly access (write/read/modify) any files stored on the ADLS from DBX code. This allows you to create a flexible Machine Learning or Big Data solution, with serious inputs and outputs.
Power BI
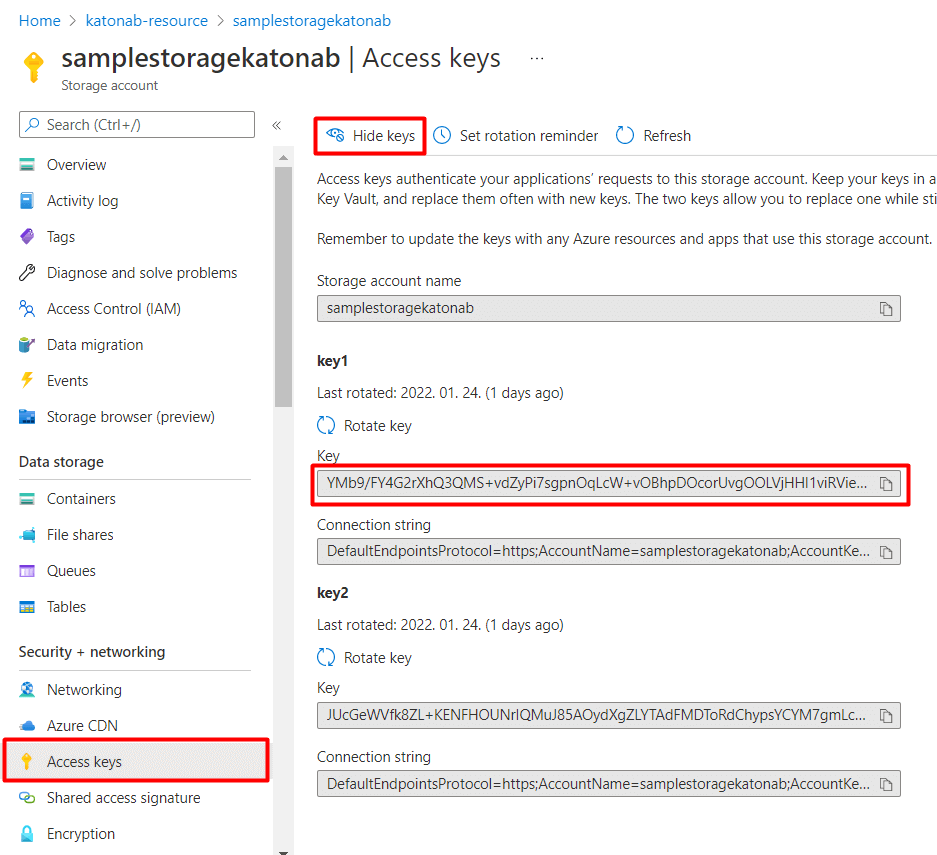
From Power BI it is very easy to connect to ADLS, pick the ADLS Gen2 connector, sign in or provide your access key (preferably in a corporate network) available on Security+Networking /Access Keys blade of the ADLS.
Publish the report if you are finished, and set scheduled refresh in the online PBI service if it makes sense (based on your data).
ADF
If your source data changes or refreshes from time to time, you may need an ADF to solve the data processing. Create an ADF in the same RG you used before, set it up and get comfortable with it in a few steps.
You can create pipelines with activities, most likely a copy activity, of which you can set ADLS as sink, and your preferred data source as source. Both cloud and on-prem sources usually have authentication that you need to comply with the following way.
- Create a Linked Service to store the connection information about the source system. It will basically stand for an independent data store. Every high-level information like id, connection string, username and password, other credentials are usually used here.
- Create a Dataset within a Linked Service to specify the exact details of the source files/table you want to connect to (both source or sink). Typically foldername, filename, text encoding, schema name, tablename, other low-level details are used here.
Since ADF is in the cloud, for on-prem data loads you need to configure an Integration Runtime (IR) on the physical machine you are using. Either you are using recurring flat files from your home PC or refreshing database tables from the company’s on-prem SQL server, you will need to have a self-hosted IR installed on the physical machine to comply with the connection details.
Real-life example
If you are curious to see a real life implementation of a similarly built Advanced Analytics platform and the benefits it offers compared to traditional data warehousing check out this short case study: Advanced Analytics platform on top of a legacy, on-premise Data warehouse.
Some more tips & tricks, know-how and best practice!
Well done! As the architecture is complete, everything is ready to operate in production. All of these components have some more useful features to know about, briefly:
ADLS
-
- Security: Access Key cans be changed, reminders might be set
- Lifecycle mnagement: Data storage tiers may be set (hot-cool-arhive) that determine data access time and the mostly cost
DBX
-
- Cluster version: runtime setting is rather easy e.g. from version 10.0 to 11.0, just open the dropdown menu
- Install libraries: easy to install any Python/R/etc by PiPy, Maven, CRAN or from external link
- Access libraries on the cluster: Notebooks can only use the lib, if they are runing on the cluster on that the lib has been installed
- Data source: you can configure other source than ADLS only
ADLS-DBX SP
-
- Connections can expire: check at the SP (Azure App) when is it expiring, usually 1 year, but it can be set longer. To renew it, the whole process has to be done again (except Azure App creation).
PBI
-
- Data sources: it is smarter to use validation by access key, and use only one data source instead of many, if new files are from the same source, this case won’t mean extra work
- PBI service: to schedule a refresh, access keys must be added here also (again, smarter to use one source so that credentials are not to be added multiple times)
ADF
-
- Scheduled triggers: set periodical execution in the lowest detail one can imagine. Run pipeline on the 2nd and 3rd thursday of every odd month? No problem to set, very cool.
- Alerts: very useful to set alerts on pipeline run failures, it helps to get known about problems at the right time
- Debug vs Triggered run: triggered run can execute processes in paralel and has greater compute capacity than simple debug. As the name indcates, use debug only for debugging
- Git: use Azure DevOps for code management. Releases, publishes, merge, pull, can be done very well.
- Azure KeyVault: store your secrets in this Azure resource. Mostly ADF focus, but can be handy many other cases
Still curious for more?
If you feel that your appetite is just coming for more advanced analytics solutions, check:
- Azure Synapse Analytics – if you want to quench your hunger with modern cloud database solutions and massive data workloads in the cloud, or take a bite to
- Azure Machine Learning – if you feel like taking an adventure with the next generation data science solution of Microsoft (an extraordinary crossover of DBX, Rapid Miner and a REST API portal)

Author of the post
Balázs Katona, BI Consultant / Data Engineer at Abylon Consulting Linkedin Profile


