Excel vs Power BI: When the Spreadsheet Breaks (And Why It Happens)

This article is part of a continuously growing series exploring my journey from finance to BI and data work. It’s based on real experience rather than a theoretical scenario. In previous posts, I shared how I realized that finance work already overlaps heavily with BI in practice, and how that transition typically unfolds step by step over time.
In this post, I focus on a specific moment in that journey: when Excel starts to break under growing complexity, and where the difference between Excel vs Power BI becomes visible in practice.
Table of Contents
When Excel Starts to Break
If Excel is the superhero suit of finance, then Power BI is the command center.
At first, Excel feels like more than enough. It’s fast, flexible, and familiar. You can take a raw ERP extract, clean it up, build a few pivots, and answer business questions in minutes. For a long time, that’s where most of us build our confidence, working inside spreadsheets, formulas, and late-night reconciliations.
And honestly, it works.
Until the data starts pushing back.
This is usually the moment when Excel limitations start to surface and when people start asking:
When should I switch from Excel to Power BI?
If you’ve read my earlier post on moving from finance to BI, you might recognize this moment. It’s usually not a planned transition, but a natural response to growing complexity, where curiosity slowly turns into necessity.
When Excel Limitations Start to Appear
It usually begins with something simple.
You get two datasets:
- Actuals from the ERP – detailed, transactional, a bit messy
- Budget – cleaner, but more summarized
The task sounds easy: compare Actual vs Budget.
So you do what you’ve always done: drop everything into Excel, add a few helper columns, write some lookups and build a pivot.
And at first, it works perfectly.
Over time, though, the file grows. Refreshes take longer, the logic becomes harder to follow, and even small changes start to feel riskier than they should.
It’s also one of the clearest signs that your Excel data model is starting to break down.
At this point, the question is no longer how to fix the file but whether Excel is still the right tool.
The Real Problem: Data Grain Explained
Actuals and Budget differ not only in content, but also how they are shaped, specifically in their data grain.
Actuals are detailed:
- daily transactions
- customer-level data
- multiple service lines
- hundreds of thousands of rows
Budget is different:
- monthly values
- often at country or regional level
- no transaction detail
- far fewer rows
They operate on different levels of detail, different grain. And Excel, by design, wants everything to line up neatly in one table.
So, we try to force it by spreading budget values across rows, stitching things together with lookups and slowly building a workbook that “works” but feels fragile.
If you’ve ever thought “this file is doing too much” – this is why.
This is where traditional data modeling in Excel starts to hit its limits.
From Excel to Power BI Data Modeling
Instead of forcing the data to match, it helps to step back and rethink the approach. A key realization is that the data does not need to look the same in order to be comparable.
This is the turning point.
It’s also where the difference between Excel vs Power BI becomes obvious in real-world analysis.
Instead of one giant table, we split things into logical pieces, which in Power BI becomes a proper data model:
What actually happened
- Actuals → detailed transactions
What was planned
- Budget → aggregated targets
How we describe the business
- Customer hierarchy → Region → Country → City → Customer
How we track time
- Calendar → Date, Month, Quarter, Year
Each part keeps its natural structure, without duplication or forced alignment. This is the foundation of a scalable Power BI data model.
A More Realistic Setup
Let’s ground this in something familiar. Imagine a service provider company.
Let’s ground this in something familiar.
Imagine a service provider company.
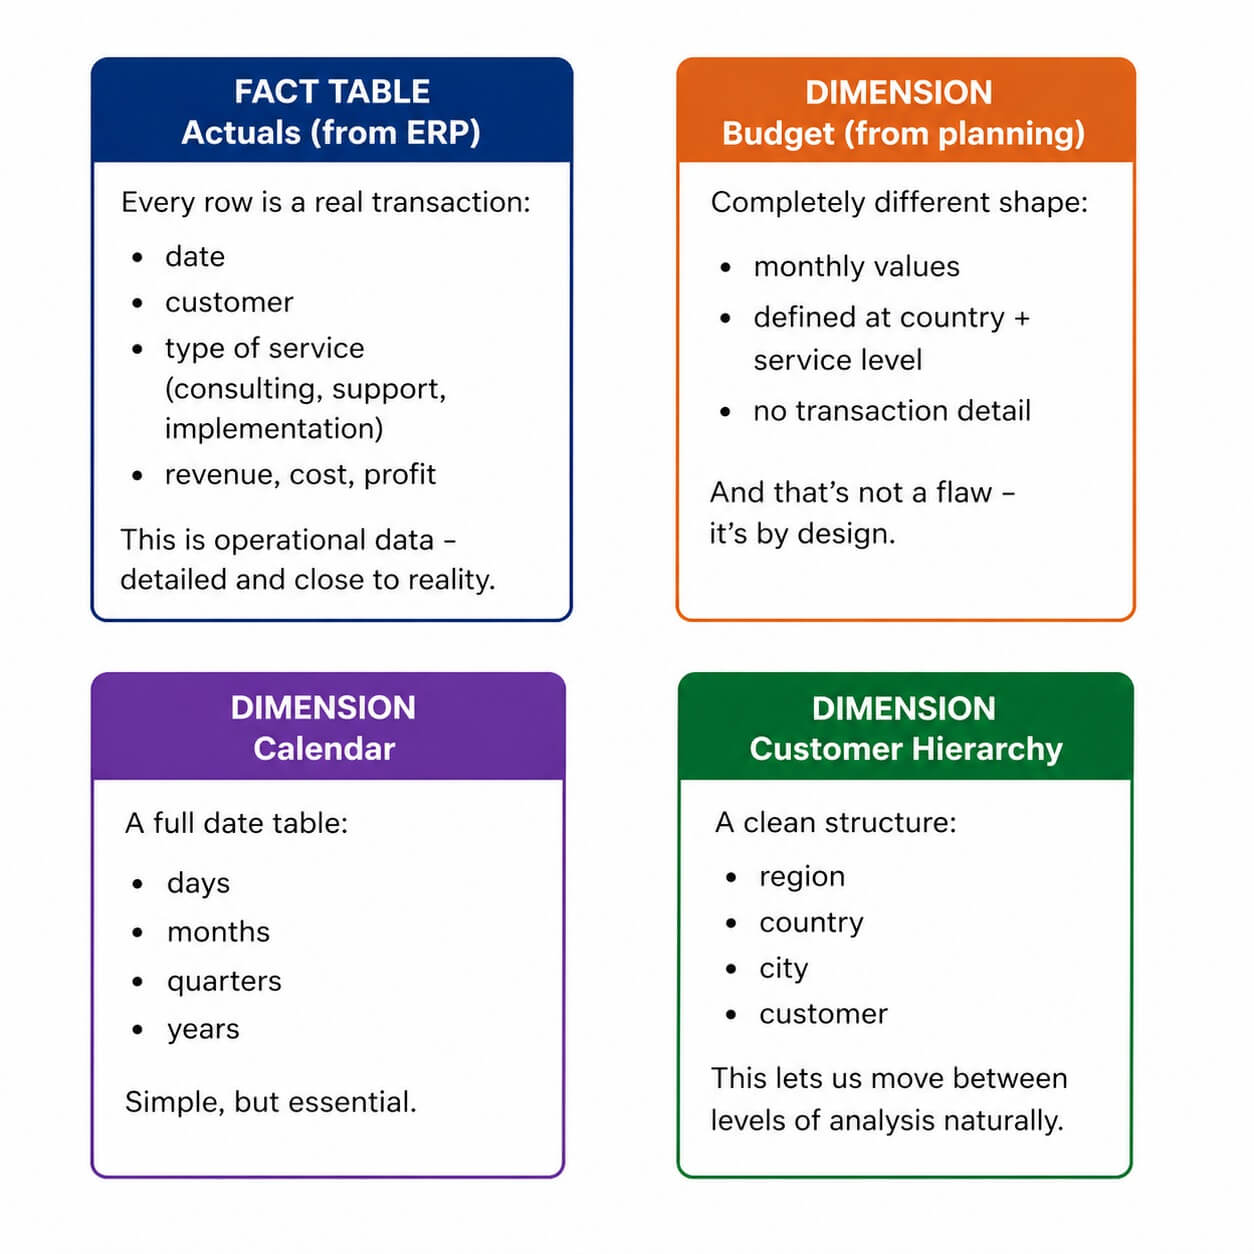
Actuals (from ERP)
Every row is a real transaction:
- date
- customer
- type of service (consulting, support, implementation)
- revenue, cost, profit
This is operational data – detailed and close to reality.
Budget (from planning)
Completely different shape:
- monthly values
- defined at country + service level
- no transaction detail
And that’s not a flaw – it’s by design.
Customer hierarchy
A clean structure:
- region
- country
- city
- customer
This lets us move between levels of analysis naturally.
Calendar
A full date table:
- days, months, quarters, years
Simple, but essential.
Where Things Start to Click
Up to this point, we haven’t written any formulas, and that’s intentional. The real improvement isn’t about better formulas, it’s about better structure. The focus gradually shifts.
Instead of asking how to match these rows, the question becomes how the different pieces relate to each other.
Excel vs Power BI: Lookups vs Relationships
In traditional Excel, we connect data with lookups.
In a data model, we connect data with relationships.
- Actuals link to Customer
- Budget links to Calendar
- Actuals also link to Calendar
And suddenly, something interesting happens.
We can compare:
- detailed daily actuals
- with monthly budget
Without ever forcing them into the same table. This is one of the key differences in Excel vs Power BI data modeling.
The Real Shift
This is where it starts to feel different.
The work no longer revolves around copying values across sheets, maintaining fragile formulas or trying to “fix” the data. Instead, the focus moves to defining logic on top of the model.
Things like, Actual Revenue, Budget Revenue, Variance and Variance %.
These are no longer static columns. They become dynamic calculations that adjust automatically depending on how the data is filtered or sliced.
This is where Power BI data modeling really starts to outperform Excel.
Why This Matters?
Because now you can switch from region to country to customer instantly, move from monthly to daily views without rebuilding anything, avoid maintaining multiple versions of the same file and work with the structure instead of fighting it.
So, What Changed?
The data itself remains the same, and even the tool plays a smaller role than it might seem at first. What truly shifts is the mindset, as the focus moves away from simply building spreadsheets toward consciously designing a model.
And This Is Where Power BI Comes In
Once you understand tables, relationships and measures, Power BI no longer feels like something completely new. It becomes the natural next step, following the same logic and the same way of thinking, while offering more scalability, more visual possibilities and easier sharing.
This is also exactly how most transitions from finance to IT actually happen. As I described in my transition journey article, the path is rarely a jump — it’s a gradual evolution from Excel to more structured tools like Power BI.
If you’re already wondering how to move from Excel to Power BI without rebuilding everything, you’re closer than you think.
From Awareness to Breakpoint to Transition
If we step back, this journey usually follows a simple pattern:
- Awareness – you realize your Excel work already overlaps with BI thinking
- Breakpoint – your model becomes too complex, and Excel starts to struggle
- Transition – you move toward tools like Power BI that handle structure better
This article sits right in the middle of that journey, at the moment where things stop scaling and a different approach becomes necessary.
Turning Theory Into Practice
Below you’ll find the tutorial files that go along with this article, including a realistic ERP extract and a step-by-step guide. This is the point where theory turns into practice – try building the model yourself before checking the solution.
Final Thought
Excel teaches you how to work with numbers. The data model teaches you how to structure them. And once you see that difference, it’s hard to go back to a single sheet trying to do everything at once. This is exactly why many teams eventually move from Excel to Power BI.

Author of the post:
Máté Csomós - FP&A & Data Analytics Specialist before, now BI Developer at Abylon Consulting. Linkedin Profile